article thumbnail

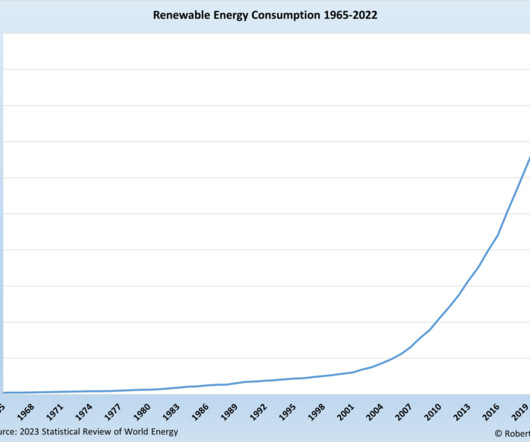
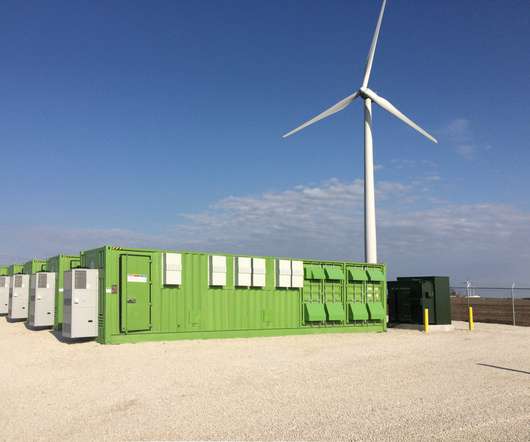
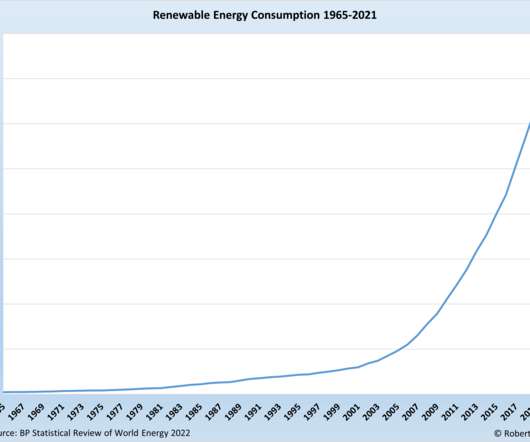
Wind and Solar Energy Take the Lead Over Hydropower

R-Squared Energy

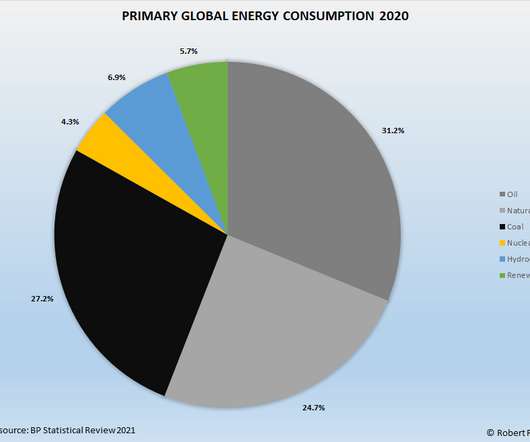
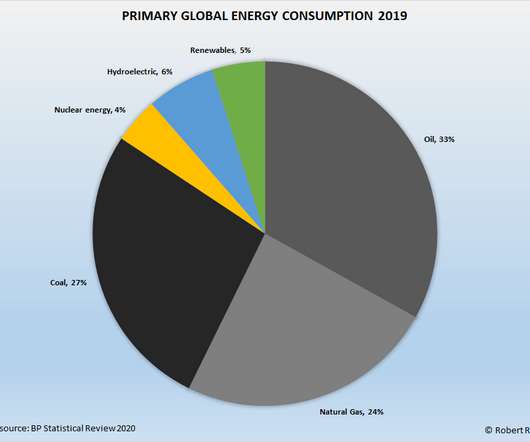
Previous topics covered were: Global carbon dioxide emissions Overall highlights Oil production and consumption Natural gas production and consumption Coal production and consumption Global nuclear power trends Today, I will cover renewable energy in detail. Global hydropower consumption in 2022 was 40.7

article thumbnail

Renewables Catching Nuclear Power In Global Energy Race

R-Squared Energy

Previous articles in this series covered carbon dioxide emissions, petroleum supply and demand, the production and consumption of coal, and global natural gas trends: BP Warns Of An Unsustainable Path. Increases Its Dominance In Natural Gas Production. Accounted For 98% Of Global Oil Production Growth In 2018. Renewables.

Insiders

Sign Up for our Newsletter

This site is protected by reCAPTCHA and the Google Privacy Policy and Terms of Service apply.

article thumbnail

Renewables account for 20% of U.S. electricity generation through Q3 2021

Renewable Energy World

Washington DC — Driven by strong solar and wind power growth, electrical generation by renewable energy sources (i.e., also including biomass, geothermal, hydropower) accounted for 20.45% of total U.S. Reflecting worsening drought conditions, though, hydropower fell by 12.47%. Natural gas remained as the top source of U.S.

article thumbnail

Renewables became second-most prevalent U.S. electricity source in 2020, per EIA

Renewable Energy World

according to the Energy Information Administration , coming in second to natural gas at 1,617 billion kWh. Only natural gas produced more electricity than renewables in the U.S. Renewables surpassed nuclear (790 billion kWh) and coal (774 billion kWh) generation for the first time on record.

article thumbnail

Renewables made up 92% of new generating capacity in the U.S. in the first half of 2021

Renewable Energy World

biomass, geothermal, hydropower, solar, wind) dominated new U.S. By comparison, net growth for natural gas will be only 13,241 MW. Thus, wind and solar combined are forecast to provide roughly five times more new net generating capacity than natural gas over the next three years. and provided 22.4% of total U.S.

article thumbnail

Renewables are 87% of new U.S. generating capacity so far this year

Renewable Energy World

biomass, geothermal, hydropower) dominated new U.S. There were also small additions in 2021 by hydropower (28 MW), geothermal (25 MW), and biomass (14 MW). . Most of the balance was provided by natural gas (2,327 MW) coupled with very small contributions from oil (19 MW) and coal (11 MW). respectively. ”

article thumbnail

Highlights From The BP Statistical Review Of World Energy 2021

R-Squared Energy

Small declines were also reported in coal, natural gas, and nuclear consumption, while renewables and hydropower recorded gains. The remainder of global energy consumption came from coal (27.2%), natural gas (24.7%), hydropower (6.9%), renewables (5.7%), and nuclear power (4.3%).