

Part 1: Revisiting the Key Findings of a California Carbon Market and Environmental Equity Study
Low Carbon Prosperity
MARCH 9, 2021
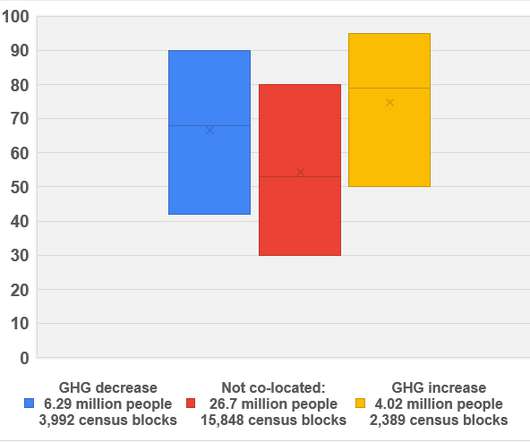
Figure 6: In-state production of nuclear and hydropower from 2001-2018. As reported in Table 2 of the original study: Across the five co-pollutant sources considered, the correlation for a 1% change in GHG emissions ranged from 0.48% for volatile organic carbons (VOCs) to 0.91% for air toxics. Data source: [link].


Let's personalize your content