ThinkGeoEnergy’s Top 10 Geothermal Countries 2023 – Power Generation Capacity
The global geothermal power generation capacity stood at 16,355 MW at the year-end 2023. Growth is picking up with further growth expected for 2024.
With this article, we are releasing our annual Top 10 Geothermal Countries based on Installed Power Generation Capacity as of year-end 2023.
While behind on some of our plans on the release on additional research on our site, we have expanded capacity and are glad to have installed a Research Manager, who is pushing ahead in the updating of our databases, planning of our research offerings and publications, as well as supporting clients. So stay tuned.
Growth continues in geothermal development, yet at a still slow pace but with promising development on the horizon and large numbers to come in later this year. We took the time to re-evaluate our approach to reporting, having sought increasingly to base or confirm our reporting of numbers on national reporting of capacities. We evaluated our existing database of power plants, compared it with numbers released from operators, national authorities, international reporting and more.
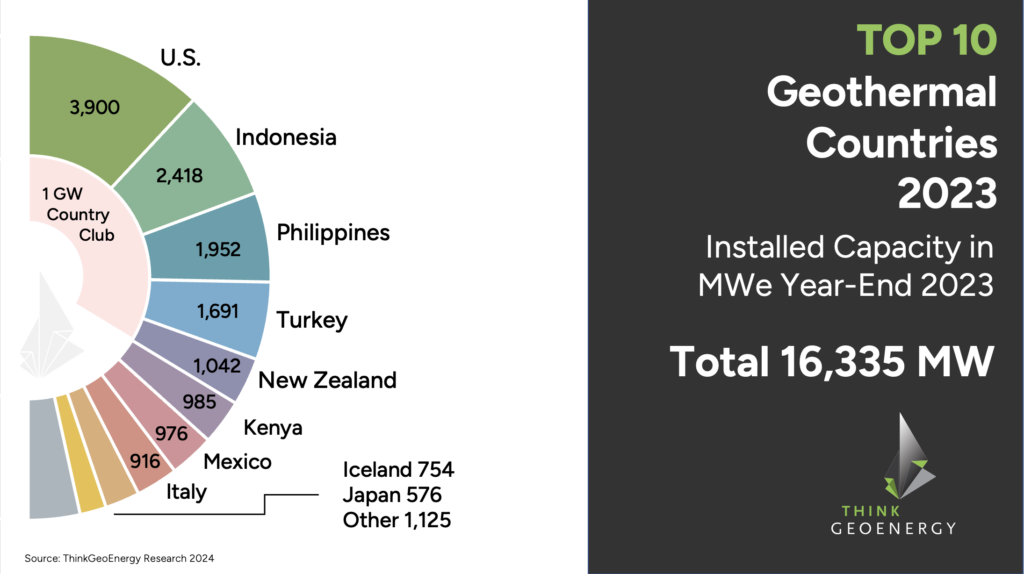
The total installed geothermal power generation capacity at year-end 2023 stood at 16,335 MW, an increase of 208 MW. For our latest numbers, we though updated and corrected our reported numbers for Japan and Italy. Without those corrections the increase would be 281 MW and with that very close to the increase of last year.
Here are the Top 10 geothermal countries as of year-end 2023:
- United States* – 3,900 MW (updated our numbers as per the notes below)
- Indonesia – 2,418 MW – with a last minute addition for 2023 at Sorik Marapi
- Philippines – 1,952 MW – updated numbers by DOE
- Turkiye – 1,691 MW – corrected numbers based on official license numbers by the Turkish authorities
- New Zealand – 1,042 MW – based on official numbers by the national regulator
- Kenya – 985 MW – addition of the first 35 MW of three plants at Menegai coming online in 2023 and some updates by numbers reported by KenGen (the country is inching closer to joining the Geothermal GW Country Club)
- Mexico – 976 MW – no change, yet updated numbers from the Ministry of Energy
- Italy – 916 MW – correction of our reporting of early 2023.
- Iceland – 754 MW
- Japan – 576 MW – corrections of plants and number based on official government numbers.
*The U.S. total installed and operational (nameplate) capacity stood at 3,900.3 MW, excluding 101.9 MW are defined as “(OS) Out of service and NOT expected to return to service in next calendar year”. Other sources (REN/ IRENA) would provide a capacity of 2,854.8 MW as average between net summer and winter capacity, which though would put up different standard for reporting for the U.S. compared to other countries. For further details see notes below.
A total of 281 MW were added in 2023. The Top 10 countries represent today around 93% of total installed capacity globally, with an additional 20 countries contributing 1,125 MW to global numbers.
In 2024, we expect additional growth in installed power generation capacity with large developments expected to come online in Kenya, Indonesia and the Philippines, as well as in New Zealand. In North America, development continues and picked up interest in recent geothermal license sales, development by new startups deploying new technologies and continued push ongoing development will see a further gradual growth of numbers. In Europe, the main emphasis remains on geothermal development for heating purposes and power generation projects are scarce with the main leader Turkiye seeing a rather idle market given current market conditions.
Notes
Gathering data on geothermal power plant development is difficult and with our ongoing work on updating our databases, we constantly tweak, update and correct data as we go along. As a disclaimer for the data presented, you will find discrepancies in the data reported by different sources and there are many reasons for this.
Some organisations report gross capacity, others operating, others installed capacity, while others take averages of summer and winter capacity. They all have one challenge in common and that is that countries and organisations are often not presenting the same numbers. The result is that numbers for one country cannot be compared with another.
So some time ago, ThinkGeoEnergy decided to apply installed nameplate power generation capacity, but only reflect the capacity that is operating – no matter if the plant produces at full capacity or not. We try our best to exclude plants and MW that are not operating, but it is not easy. For some countries one simply has three or four different data sets and needs to make a decision that might prove to be wrong in the end.
We are also increasingly double checking and confirming with official numbers by government agencies or national regulators to guarantee numbers that are comparable and as correct as possible.


