The International Energy Agency may rightly be the butt of many a meme for its history of getting its forecast solar installations horribly wrong, but it has some great monthly electricity data on the countries that are IEA members (i.e. not including Asia or Russia).
The data for IEA member countries might be a bit late – it is current up to March – but it shows some significant changes over the last 13 months, most notably in the growing amount of variable renewables (wind and solar) and the decline in coal.

I am not yet clear whether the IEA’s definition of VRE includes “behind the meter” solar. Note that this data is the sum of all the individual countries including the US, and thus the larger countries have a big impact on the total.
In other words, the trends might just be the trends of the large countries in the IEA.
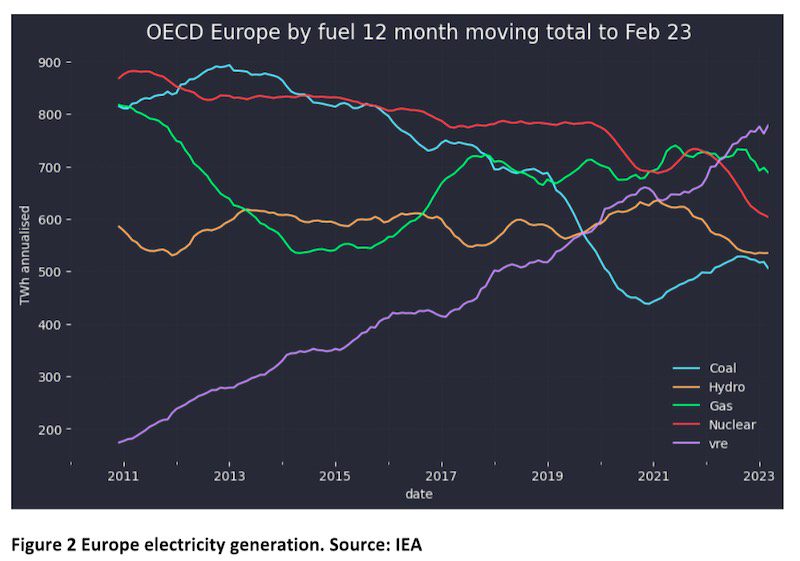
For Europe, arguably the most forward thinking region in the world, at least in regard to this field, VRE is now the largest fuel source and the decline of coal and to a lesser extent nuclear is clear.
Unlike the US, gas has not really grown much.

The US has seen twice the decline in coal of Europe, as measured in annualised terawatt hours (TWh) from around 1800 Two to around 750 TWh.
But gas has captured the largest share of the replacement supply and VRE is yet to catch up with nuclear.

The China data is up to May, 2023. I guess you can say it’s good news that VRE in China is about to overtake hydro, but – unlike virtually every country covered by the IEA – China’s coal, or at least thermal fuelled electricity output, is still growing strongly.
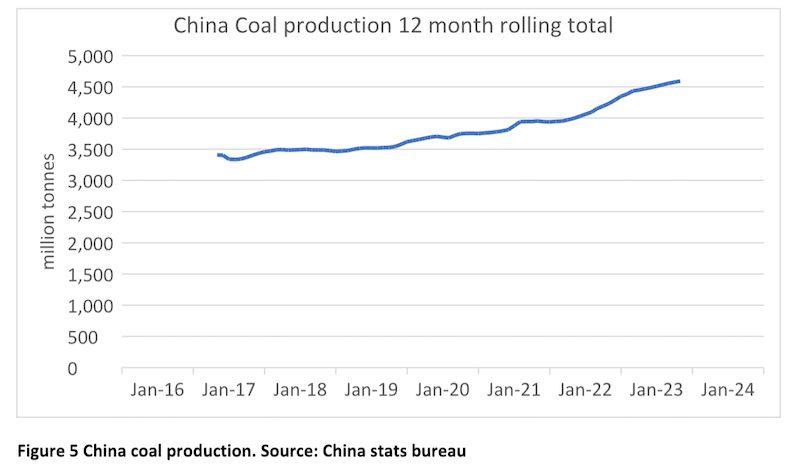
China’s annual coal output has increased 1 billion tonnes over the past four years.
On the one hand that is a fantastic technical achievement. Assuming a big mine can do say 10- 20 mt per year that’s 50-100 new mines in four years. On the other hand, its absolutely screwing the environment in so many different ways but primarily through the burning of the coal.
On top of that China’s total annual output at 4.5 bt per year will require a fantastic rate of mine replacement as the existing mines age.
If China runs that output for, pick a number, but 15 years doesn’t seem unreasonable; that’s about 70 billion tonnes of cumulative coal: 70 billion tonnes. But it’s China right, they produce lots of solar panels and wind farms, so 70 billion tonnes of coal is OK.

Australia looks to be progressing steadily, but I expect a slow down until the governments and agencies find a way to deal with increasingly organised negative social license.
Electricity transmission is not that bad. It’s been around for a long time and although it doesn’t look great, it was never a subject of conversation in terms of its look until recently. All of a sudden it’s a big bogey.
I’ve already pointed out how at least on paper the EU now requires wind farms in approved areas (eg REZ equivalent) to be approved within two years.
“The EU’s emergency regulations define wind and solar as projects of overriding public interest and clarify the environmental and grid permit deadlines that approval authorities must meet within two years. The burden of proof for environmental protection is shifted from developers to public agencies and developers can use a wider range of measures to protect endangered species. Shorter approval deadlines for repowering projects will aid developers upgrading existing sites.” Source: Reuters December 2022
If it can be done in space constrained Europe it can be done far more easily in Australia, which has better wind and solar resource and far more suitable land.
Of course there are other environmental considerations like the Barrier Reef and “stuff”, but right now there is a strong feeling that it’s too hard.
Australian electricity prices fell last week, thanks to more wind
Prices fell sharply last week although the 30 day average is still over $100/MWh in NSW and Victoria.

The prices fell because wind volumes were about 35% higher than last year, sharply reducing the ability of gas generation to set prices. You’ll have to forgive this early attempt at a Python waterfall chart but what I see is the expensive fuels, gas, hydro and coal all saw a decline in volumes in the week.
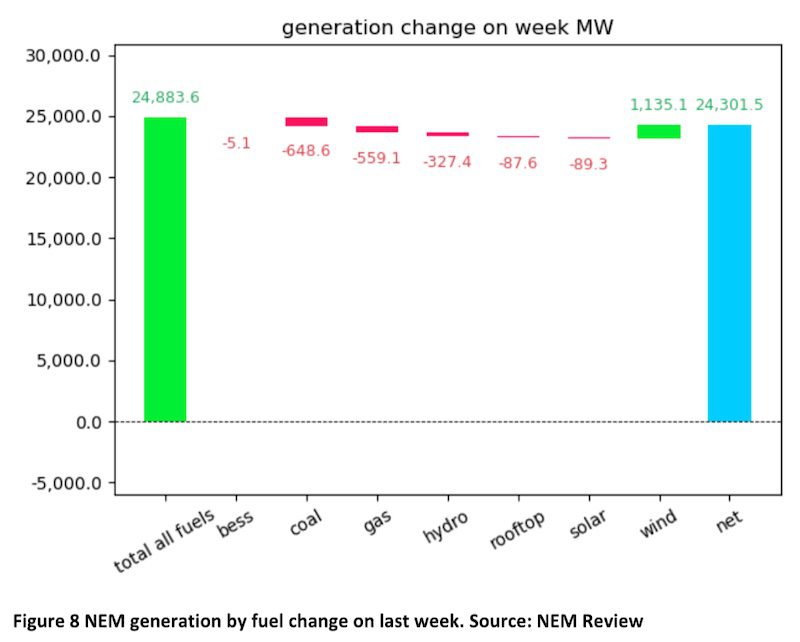
Normally, I don’t take much notice of weekly changes but to my mind what it shows is just how sensitive price is at the moment to relatively small changes in the fuel composition and the total demand. You might consider it would only take another 2,000 MW of wind to move electricity prices down in a measurable way.