In recent years the take-up of rooftop solar for electricity generation by households in Australia has been nothing short of remarkable.
Driven by high levels of solar radiation, decreasing PV (photovoltaic) costs, attractive feed-in tariffs and now climate change, rooftop solar has been spectacularly successful. It is claimed that Australia now leads the world in the use of rooftop solar.
This may sound like great progress, however, the excess power generated by rooftop solar and exported to the grid is creating major grid issues as exemplified by the so-called duck curve.
Occurring mainly on clear days when excess power from households significantly exceeds the underlying load demand, dispatchable power generation is significantly decreased during daytime hours.
As sunset approaches the dispatchable power must be rapidly ramped up to replace solar, causing the shape of the net power curve to resemble that of a duck.
Identified in 2008, the duck curve has been labelled the biggest issue facing PV power generation. The cause is the virtually uncontrolled generation of excess solar power from household rooftop systems during daytime on clear days.
AEMO data for dispatchable and rooftop solar power generation on five consecutive clear days in mid-October 2020 for Western Australia are shown in Figure 1.

The data clearly shows that rooftop solar displaces other power generation during daytime by as much as 50%. In the late afternoon slow to respond generators, particularly coal, must be rapidly ramped up to replace the dwindling solar power as sunset approaches.
The ramping also needs to respond to the increase in underlying household load demand in the late afternoon, putting additional stress on the system.
Figure 2 illustrates the origin of the duck curve at the household level. Clear day energy flows in a household with rooftop solar are shown. It is assumed that the household load is 20kWh per day and that a 4kW PV array has been added.
The load curve exhibits morning and late afternoon/evening peaks typical of household energy use. The PV power generated by the rooftop array peaks at midday and totals 23.6 kWh over the day.
The rooftop power is supplied to the house is behind the meter (BTM) and is not directly measured by the retailer. The rooftop power significantly exceeds the household load during daytime hours, eliminating the need for backup power from the grid during this period. The excess energy (negative values) equals 16.1kWh, 68% of the rooftop energy on this day.
The excess energy is exported to the grid in front of the meter (IFM), attracting a small feed-in tariff (FiT) for the householder. Backup energy equal to 12.5kWh is still required to meet the daily load after the sun has set and until the sun rises the next day.

IFM power curves for the house before and after adding a 4kW PV array are shown in Fig 3. With no rooftop array the IFM power is all in one direction, from grid to house. With the rooftop array the excess power exported from the house to the grid causes the duck-like profile (dashed red line in Fig. 3).
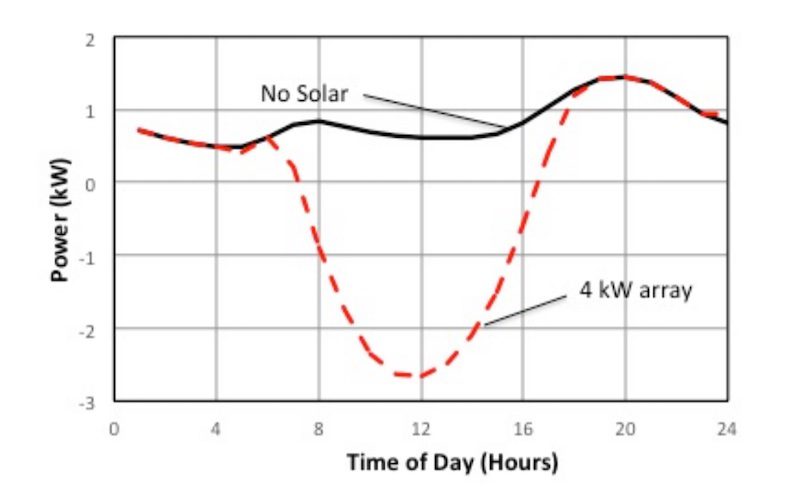
As illustrated in Figs 2 and 3, the root cause of the duck curve problem is the significant excess energy exported on clear days by households. During the daytime this energy displaces coal and other fossil fuel generation.
As sunset approaches the dispatchable generators that have been idling all day have to be ramped up to make up for the loss of PV generation. The rapid ramping, particularly of older coal fired generators that were never designed for this purpose, is a major issue.
Grid level solutions to the problem have focused on treating the symptoms rather than the cause.
For example, some states now have regulations in place to allow the relevant authority to turn off the export of rooftop solar (curtailment) whenever major stability issues arise. With continued growth of rooftop solar and the need to reduce carbon emissions this solution is clearly not sustainable.
It is well recognised that big batteries can provide a fix for the problem by storing the excess solar rooftop energy generated during the day to meet the evening household load peak.
However, the focus of big batteries to date has not been energy storage but rather providing higher value ancillary services such as FCAS to the grid.
Since the problem starts at the bottom (households) it makes more sense to fix the problem there, using a bottom-up solution.
The fix to the problem is to decrease export of excess household energy to the grid to manageable levels without reducing generation and self-consumption of solar. This can be achieved by storing excess energy using household batteries and other storage such as hot water.
An example of the household storage solution is the addition of a ~16 kWh battery to the household PV system shown in Fig. 2. This level of battery storage enables the household load to be fully met on this day with no excess energy exported to the grid. The IFM power flow is reduced to zero for the entire day, eliminating any household contribution to a duck curve problem.
However, without control of battery charging, the addition of less storage can have a significant effect on the export energy profile.
Fig 4(a) shows the IFM curve for the previous example after adding 6 kWh storage, sufficient to meet the household load during the peak ramping period from 3:00 to 9:00 pm. If no battery control is in place battery charging starts in the morning when the PV power exceeds the load and finishes when the battery is fully charged (on this clear day at 11.45 am).
During this period there is no export of energy to the grid as all available excess power is used behind the meter to charge the battery. Once the battery is fully charged the power export to the grid returns to its value without battery storage.
Later in the day the stored energy supplies the peak period household load. However, the energy stored in the morning has no effect on the export of excess household power to the grid during the critical late afternoon period.
Solutions to this problem include delaying the start of charging to later in the day or controlling the charge current to spread out charging over a longer period. Fig 4(b) shows the IFM power curve for afternoon charging commencing at 12:00.
It is seen that delaying the start of charging to noon, removes both the afternoon excess energy exported to the grid and the load during the peak ramping period. The IFM power flow is zero for an entire 9-hour period from noon to 9 pm, resolving many of the issues otherwise caused by rapid ramping of dispatchable generators in the late afternoon.

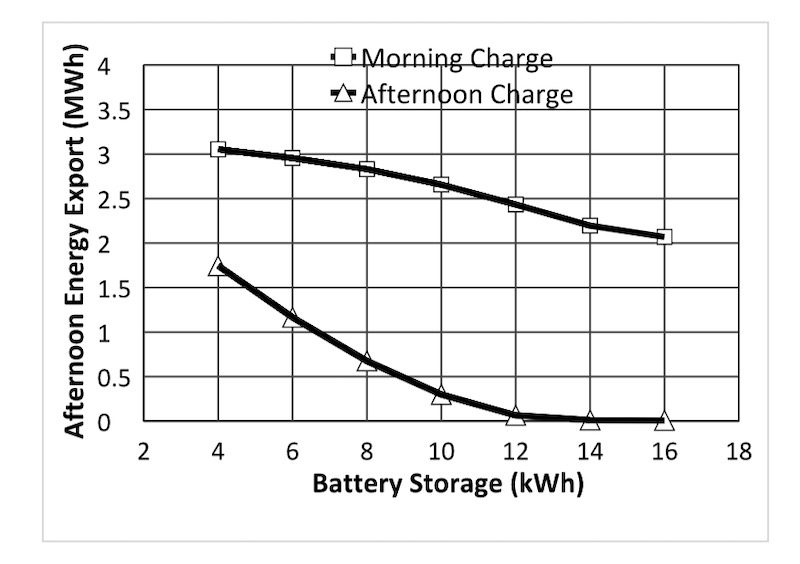
Our yearly calculations using Perth radiation data confirm that the time of day, morning (AM) or afternoon (PM), over which battery charging is carried out has a significant effect on the distribution of export energy over the day. Fig 5 compares the afternoon energy export for AM charging with that for PM charging.
While increasing battery capacity decreases afternoon energy export for both AM and PM charging, PM charging significantly reduces afternoon energy export.
With sufficient battery capacity, in this case 12 kWh, PM charging eliminates afternoon household energy export to the grid. These results show that controlled household battery storage can provide significant grid stabilization. No new infrastructure apart from the batteries and controls are required.
Australia leads the rest of the world in the generation of rooftop solar. However, the same cannot be said about the take-up of household batteries.
For example, in Germany ~ 70% of the household solar systems had battery storage in 2020, with average storage capacity of 8.5 kWh. In Australia in 2021 only ~2.8% of new PV installations included batteries.
Strong Government incentives are needed now to significantly increase the take-up of household batteries. In its present form the Small-scale Renewable Energy Scheme (SRES) exacerbates the Duck curve problem by providing incentives for households to generate significant excess energy while at the same time, no incentives are available for household batteries to store and use the excess energy.
Now is the time for the SRES to add effective incentives for household batteries. The State and Federal Governments need to lead the transition to household batteries as was done originally with rooftop solar. As well, planning needs to start for the day when household batteries supply a significant fraction of household energy requirements.
Paul McCormick is Emeritus Professor Mechanical Engineering at the University of Western Australia