The Queensland state government has revealed the details of its new energy blueprint. It includes:
– 25 GW of new wind and solar (50:50 mix) by 2035
– 7 GW of new rooftop
– 7 GW of 24 hour pumped hydro
– a new 500 kv North South transmission backbone.
All in all, a total of $62 billion of new investment to 2035. Of course, it will end up being at least 20 per cent higher than that, the only sport being how much higher.
Personally, it’s far from clear to me that having the government fund it all is the way to go. I am a capitalist and a believer that Cournot or properly competitive markets are the best way to allocate resources and that governments can manage distributional effects through taxes and policies.
Still, that is not the Queensland way. This program will see the government having to raise the majority of the say $70-$90 billion. If well executed, and that’s a big if, the state government says it will cut wholesale prices too around $56/MWh. We shall see.
The basic argument is that fuel (coal and gas) costs are avoided and that will offset the annual cost of capital paid for the wind and solar.
It’s easy to show that the required electricity price to justify a new wind or solar project is less than for a new coal project, but then we also have to add in the transmission and firming (pumped hydro) costs and see if the total is less.
Fundamentally it’s likely the lowest economic cost solution would have more wind located closer to load, more batteries, perhaps by subsidy of household batteries, and less transmission.
Queensland has gone bigger on solar which requires more storage than wind (storage is needed every day) and it has chosen to build the storage and wind a long way from demand, pushing up the required transmission cost.
Still, if this means the plan is achieved and Queenslanders are happy with the outcome, then it may well be sound policy.
One strong advantage of the Queensland government ownership is that it can control the timing and close the coal stations in the most sensible fashion.
In contrast to the Integrated System Plan produced by the market operator, the Queensland plan has a lot more solar, with the wind moved to the North of the state and out of the Darling Downs. Pumped hydro replaces behind the meter storage.
The largest project is the ill-defined Burdekin-Pioneer pumped hydro (there is already a Burdekin dam servicing the sugar industry which suffered cost overruns when built by Leighton back in the day).
The new project has 5GW/24 hour capacity and could be built in two stages. Lots more water to flow over the spillway, so to speak, on this project.
Regarding the transmission, the document states:
“Delivery of this major transmission infrastructure program will be a significant challenge. It represents the largest transmission construction program ever undertaken in Queensland, over a relatively short period of time.”
So, in a southern state this wouldn’t be possible based on recent experience.
The Blueprint document says the existing coal generation will be repurposed, but the reality is that lots of the coal generation will go away. Batteries are already beating out purpose-built synchronous condensors – but that is a detail.
I go through the least cost approach the ISP modelled below, for comparison.
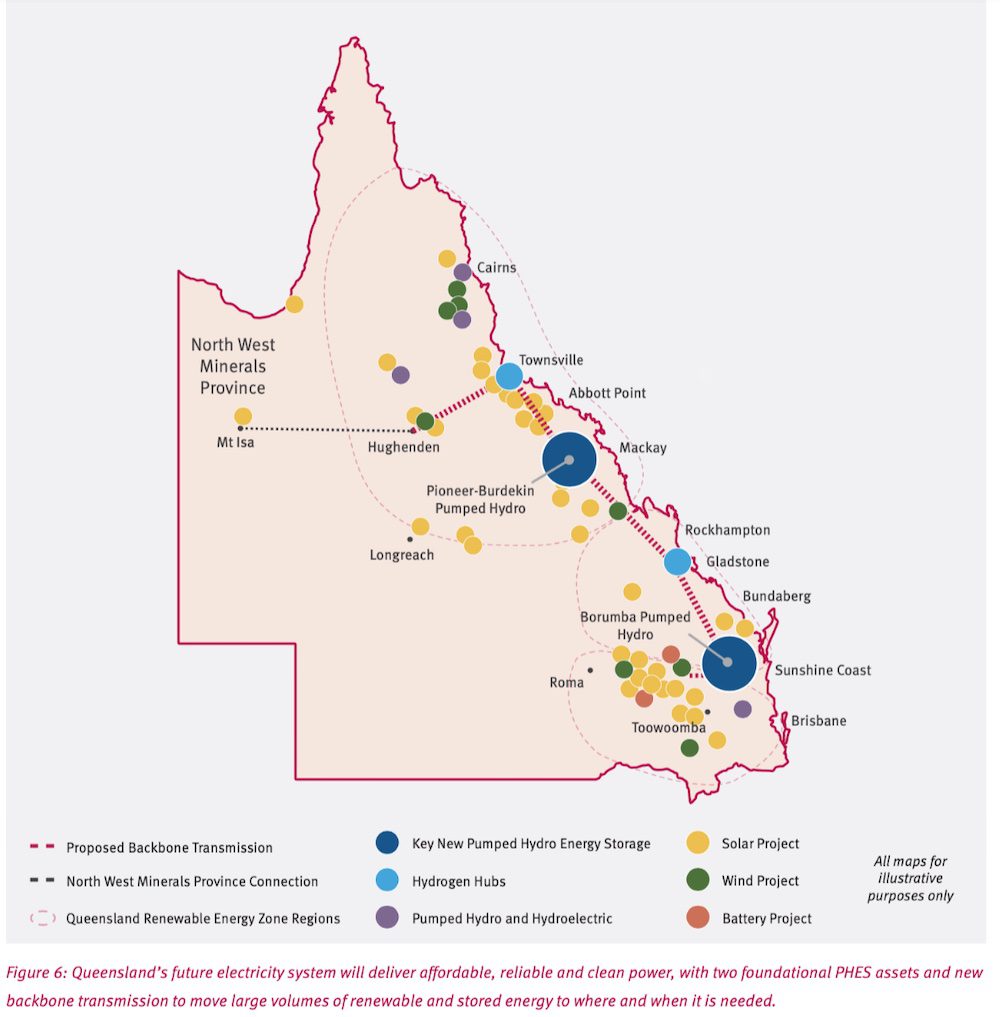
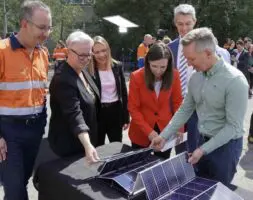
Figure 1 QLD $60 bn plus renewable plan. Source: QLD Govt.
Queensland renewables plan legislates 70% renewable by 2032, 80% by 2035
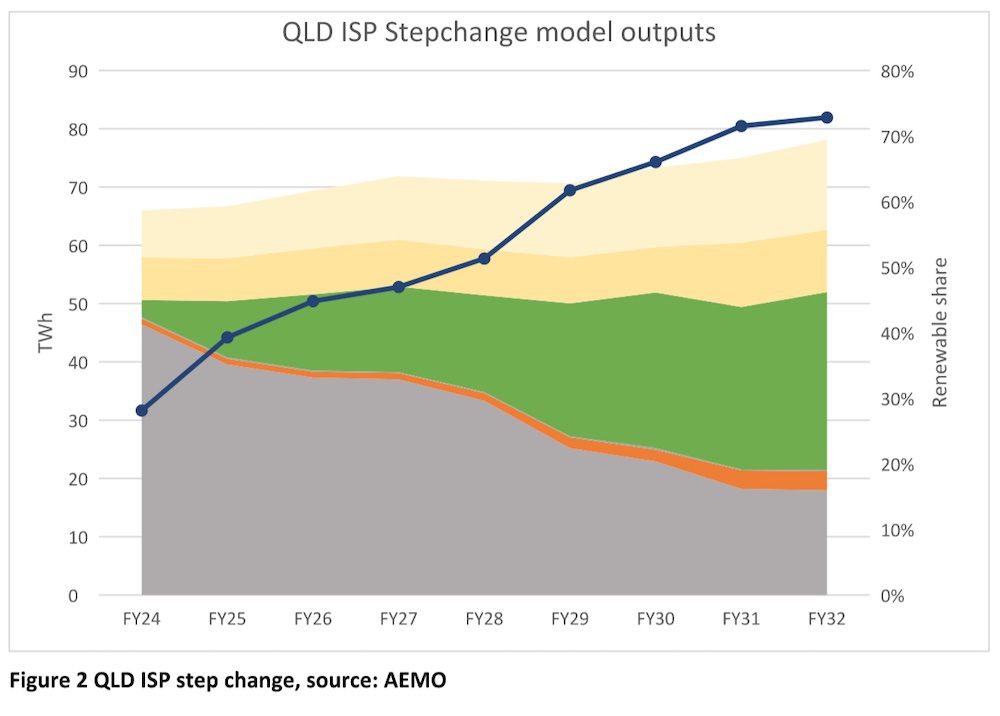
The 70% target is consistent with the outputs of the “Step Change” scenario of the ISP reproduced and summarised in figure 1.
ITK has spent more time than it should have considering Queensland over the past 12 months and I’d draw attention to:
- If you assume that exports to NSW are relatively flat then the forecast shows demand growing reasonably. Total supply was 59TWh for the 12 months ended 27 Sep 2022, growing to 78TWh by 2032 or over 30%. Relative to the last decade this is strong.
- Growing the renewable supply is, in a sense, easy – you just build and connect the projects.
- The forecast has way lower coal output. Queensland’s coal output was 46TWh in the past 12 months and falls 60% by 2032 to 18TWh even with the demand growth. Queensland has around 8GW of coal generation capacity and the implied 2032 capacity factor is just 25%. Gladstone will surely close before then. Most other plants will not be viable, will not be able to ramp on a daily basis at anything like the required rate, etc. So they could go into standby mode, but that does nothing for jobs.
- It also means lots and lots more capacity. There is a limit to what rooftop solar can supply, even with more supportive policy than exists today.

This basically amounts to 1GW of new wind a year or about $2 billion per year which, at say $2m a MW, is $18 billion in total, not that it ends in 2032. Just like global warming, the investment requirement keeps going.
Most of this wind is presently scheduled to go into the Darling Downs, so a lot of social license preparation is required. In total using 5MW turbines we are talking about, say, 1,800 turbines. I personally love the look of the wind turbines but having 1000 of them around Toowoomba is certainly going to create some talking points.
I created this map of the ISP’s modelled output by REZ as of 2035. The size of the bubble is the relative amount of energy supplied by that REZ.
I was going to colour it to show the relative solar and wind contribution and also to make it animated to show the bubbles grow over time but some of the python/folium libraries have obscure syntax requirements and I didn’t get there yet.
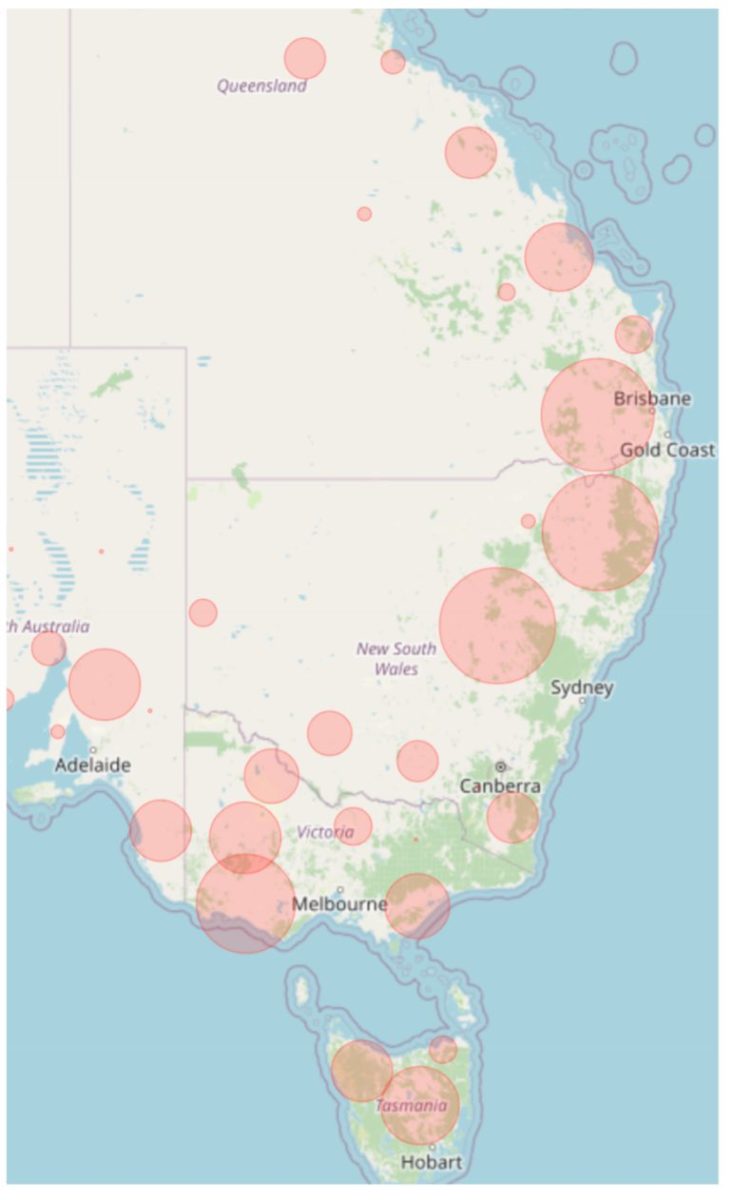
Figure 4 NEM wide 2035 REZ output, source: AEMO
The Queensland plan contrasts with the Victorian approach to some extent
In Victoria there is generally stronger opposition to transmission and less opportunity or desire for large pumped hydro projects.
Tasmania under the ISP provides high value wind and lots of storage but there is massive greenie opposition to doing anything in Tasmania other than tourism.
So Victoria is focused much more on offshore wind and batteries. In my opinion, offshore wind will be way more expensive than onshore wind developed in the Darling Downs or North Queensland.
As far as batteries go, the fact is that batteries will not economically do seasonal storage. Some commentators claim that no seasonal storage is needed in highly renewable grids, but the vast majority of analysts – including me – think it is.
Pumped hydro projects last for 50 years and have lower annual maintenance costs than batteries.
On the other hand, like all big concrete and shovel projects they are subject to cost overruns, their round trip efficiency is generally lower, they require transmission to support them instead of supporting transmission, and for many people dams are unpopular.
However, I expect that a majority of North Queenslanders will greatly support new dams. There is a ginger group forever trying to get the Bradfield scheme up, there are constant proposals for new dams for agriculture and there is far less opposition to transmission.
Building a dam is something Queenslanders will be very comfortable with – well suited to the skill set of say open cut coal miners. Equally building new transmission has a far lower social license cost in QlD than just about any other state.
According to my analysis of wind farm trace factors provided as a data set for the ISP modelling, Tasmania on average has the best wind capacity factors followed by the offshore zones. Some of the offshore zones have their own problems.
Those in Queensland may well be close to the Barrier Reef and the NSW one requires floating wind. Floating wind may one day be a thing but I cannot see the point of pursuing it in Australia right now when so mant cheaper alternatives do exist.
Moving the wind farms to North Queensland is probably sub optimal
As can be seen in the map above, AEMO puts most of the Queensland wind into the Darling Downs. The Queensland government wants to build most of the wind in North Queensland (see Fig 1).
It is true, as figure 5 shows, that North Queensland has some of the best wind resources, but it’s a long way to the load. Cairns to Gladstone is 1100 km where there is over 1GW of load and it’s another 500km to Brisbane.

Those zones that are above 40% (the NEM wide average is 38%) are:

These capacity factors will not be realised directly. For each zone AEMO publishes for each half hour (out to 2051) a high and a low factor. I averaged the high and low series and then calculated the average over roughly (80 * 8760) half hours. Zones would have turbines interfering with each other, MLF losses and other things that would probably bring the averages down a good 5-10% in reality.
The point is that Tasmania has great wind resources and is located relatively close to load (Launceston to Melbourne is just 540 km).