Oil & Gas Group
This group brings together those who are interested in topics around oil and gas exploration, drilling, refining, and processing.
Post
[Report] The State of Shale Oil & Gas Q3 2022

The State of Shale Oil & Gas — 2022
The Permian, Eagle Ford and Williston. These 3 basins are good for over 6.5 million b/d of US tight oil production (almost 85% of total US tight oil production).
In this post, we will analyze the latest developments in the 3 US tight oil basins that are producing more than 0.5 million b/d, which includes the Permian, Williston and Eagle Ford
1. Total production
Total oil production from the over 85 thousand horizontal wells in these basins is on the rise again, after peaking in March 2020 (at over 7 million b/d). We expect July output to hit around 6.7 million b/d, after upcoming revisions:
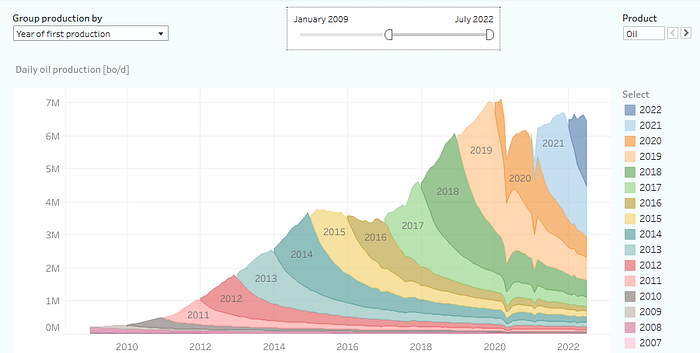
Reported oil production in the 3 major US tight oil basins, through July, colored vintage.
2. Drilling activity
The horizontal oil-directed rig count in these 3 basins has increased from 304 in October 2021 to 435 in early October 2022. Growth in drilling activity stagnated as WTI has come down significantly from the $120 peak in June 2022:
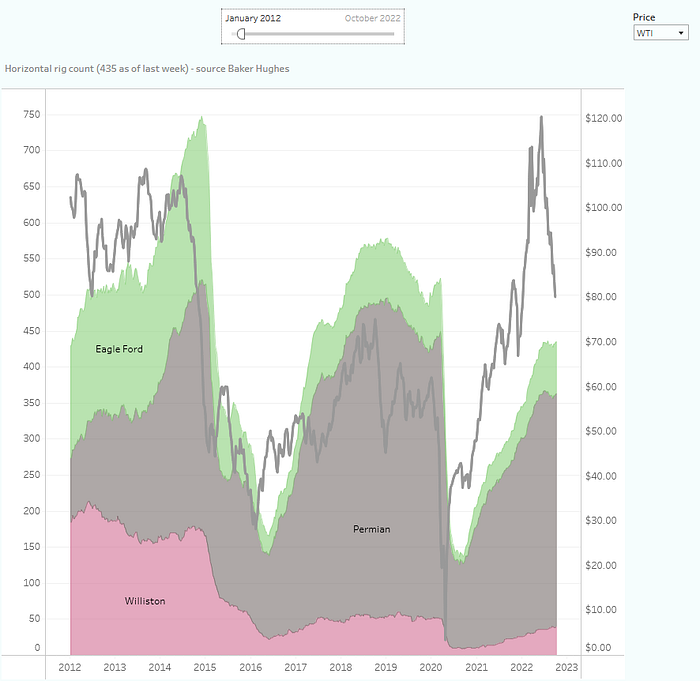
Horizontal oil-directed rig count in the 3 major tight oil basins and WTI (right hand side).
3. Well productivity
Well productivity has changed significantly over the years, with increases driven by improved completion designs, but also with more negative effects from infill drilling becoming clearer. Not normalized for the increase in lateral length, average well performance in these 3 basins is still near peak levels:
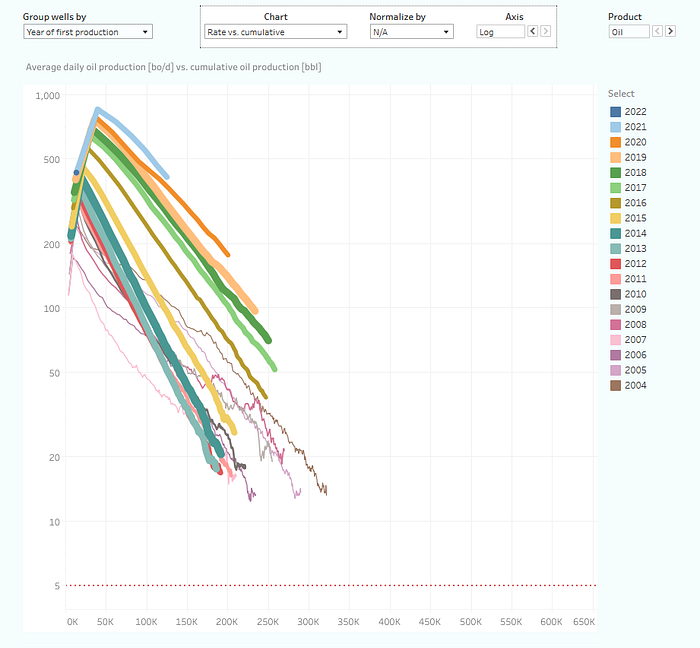
Well performance (average oil rate vs. cumulative oil), by year of first production. Horizontal oil wells since 2004 only. Thickness indicates relative well count.
Horizontal oil wells completed in these basins in the last 2 years are on track to recover between 400 and 450 thousand barrels of oil before declining to stripper well status (~10 b/d).
Of course there are major differences in productivity trends between these basins. The following overview shows how well productivity, as measured by the average cumulative oil recovered in the first year on production, for every 1k feet of lateral length, has changed within each of the subbasins
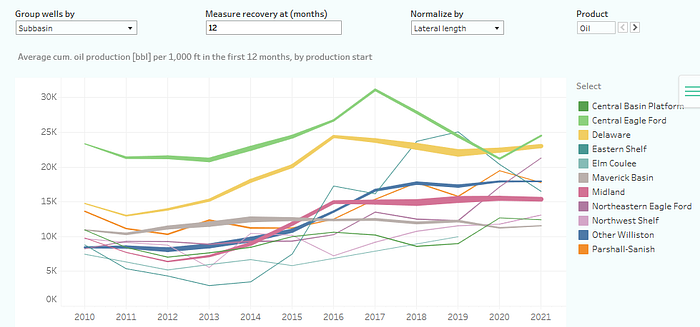
Well performance (average cum. oil in the first year, per 1k of lateral length) by subbasin and by year of production start. Horizontal oil wells only. Thickness indicates relative well count.
Note that based on this metric, productivity growth has stagnated in several key areas, including the Delaware and the Midland basin, while it has already clearly fallen in the Eagle Ford.
4. Top oil producers
The following overview ranks the top-12 oil producers within these 3 basins, through June 2022:
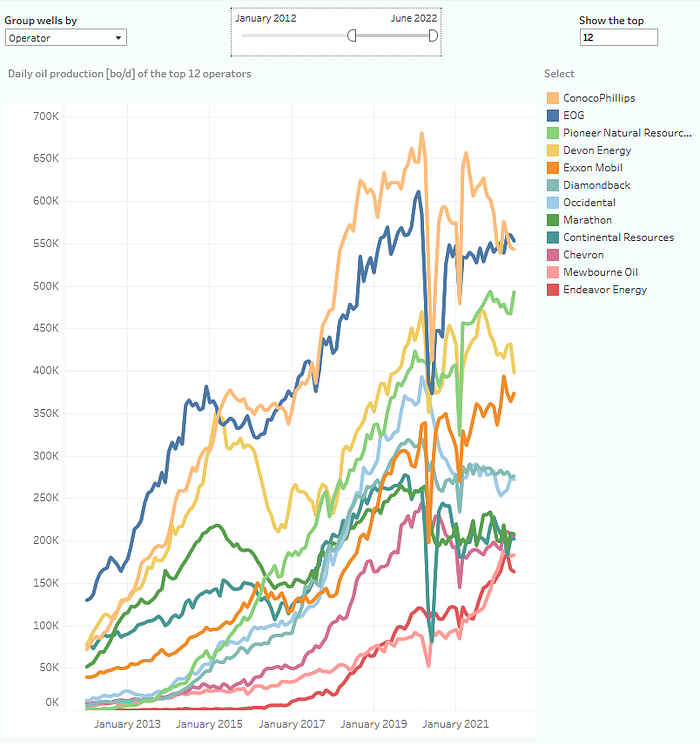
Production history (b/d) of the top 12 US tight oil operators in these 3 basins.
5. Operator productivity ranking
Finally, we take a closer look at which operators have the best and worst performing wells in the Permian Basin. In the following overview, from our Productivity Ranking dashboard, you can find a ranking of all major tight oil operators with at least 100 completed wells in the last 4 years. They are ranked based on average well productivity, measured by the average cumulative oil production in the first 12 months, Only horizontal oil wells with a production start after 2018 are included.
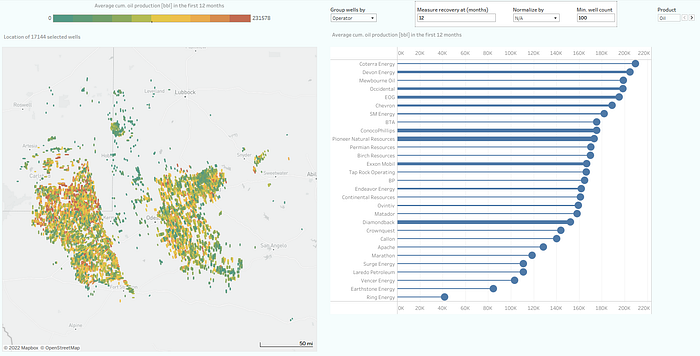
Ranking of all major operators in the Permian Basin, based on average well productivity (cumulative oil production in the 1st year). Horizontal oil wells with a production start after 2018 only. The map shows all the included wells, colored by the same metric.
Coterra Energy ranks as the number one on this metric, as the 330 horizontal oil wells that it has completed since 2018 recovered on average 210 thousand barrels of oil during their first year on production. Ring Energy shows the worst performance, as its 134 horizontal oil wells recovered just 42 thousand barrels of oil during their first year on production.
— —
Download the full report here: https://bit.ly/3NiLrVK
Want to further explore industry data?
You can directly book a demo via novilabs.com/demo to see the energy analytics platform in action.
*All the graphs today come from Novi Insight Engine, which is an online analytics platform filled with interactive dashboards that allow you to explore the most recent shale oil & gas related data
Discussions
No discussions yet. Start a discussion below.
- The Permian tight oil production peaked at 5.4 million b/d in January, 2% higher than a year earlier.
- Drilling Into Oblivion: Can Any Haynesville Operators Make a Decent Return at Sub-$2 Gas?
- Tight oil production in North Dakota took a big hit in January, falling by over 200k b/d.
- [Report] Revealing Horizontal Well Oil Production Across Major US Basins — December 2023
Get Published - Build a Following
The Energy Central Power Industry Network® is based on one core idea - power industry professionals helping each other and advancing the industry by sharing and learning from each other.
If you have an experience or insight to share or have learned something from a conference or seminar, your peers and colleagues on Energy Central want to hear about it. It's also easy to share a link to an article you've liked or an industry resource that you think would be helpful.


Sign in to Participate