Australian solar farms are having half of their output curtailed by grid congestion in some instances, with renewables bearing the brunt of over-capacity – even though their output is cheaper and cleaner than coal and gas generation.
A study by a team of researchers at the Australian National University involved in its Battery Storage and Grid Integration Program shows that solar and wind are bearing the brunt of congestion management in Australia’s main grid, with some facilities hit particularly hard.
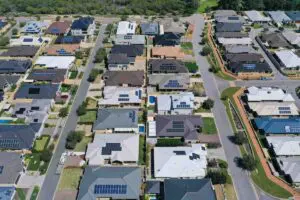
Nearly one dozen wind and solar farms are being impacted on more than 100 days a year, while two solar farms – Molong and Manildra in western NSW – suffered losses of output of 53 per cent and 48 per cent respectively in calendar 2022.
Both solar farms are located on a part of the network known in the industry as the “line of losses”, which is emerging as an even more challenging part of the grid than the so-called “rhombus of regret” in Victoria that is the second biggest source of frustration and revenue losses. (See map below).
See: Black Spot program needed to address solar’s “line of losses” and other grid bottlenecks
The ANU findings are contained in a submission to the Energy Security Board’s controversial Transmission Access Reform, which has led several peak bodies to warn that proposed reforms could bring new developments to a halt. The Smart Energy Council has branded the proposals as a “solar stopper”.
The ANU report highlights problems in the way the grid is managed, including in the way that AEMO applies so called “negative mic-pricing adjustments” to relieve congestion.
The report also cites the failure to give enough incentives for battery storage to help solve the problem. In some instances, when batteries discharge, the situation is actually made worse.
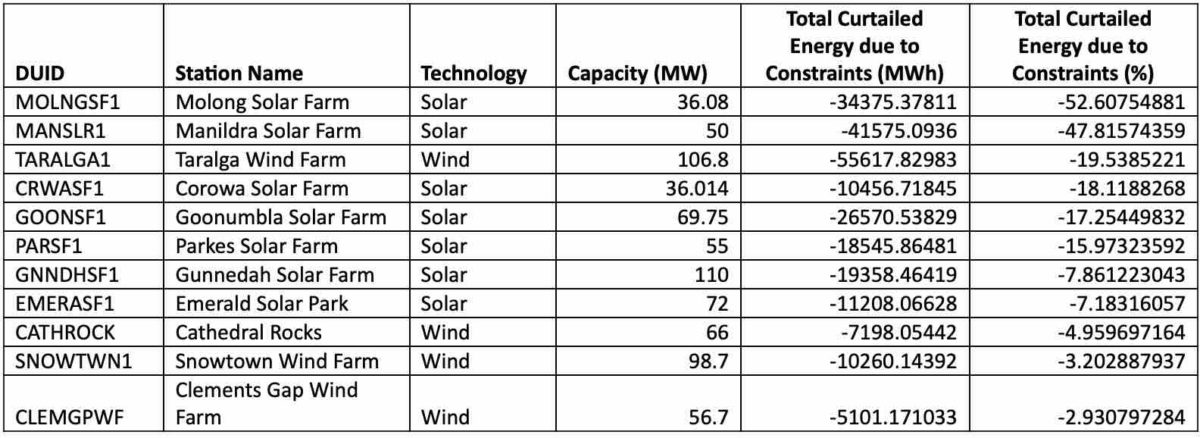
This graph above highlights the worst affected solar and wind farms located outside of planned renewable energy zones, which suggests that their problems may not be easily addressed without proper market reform.
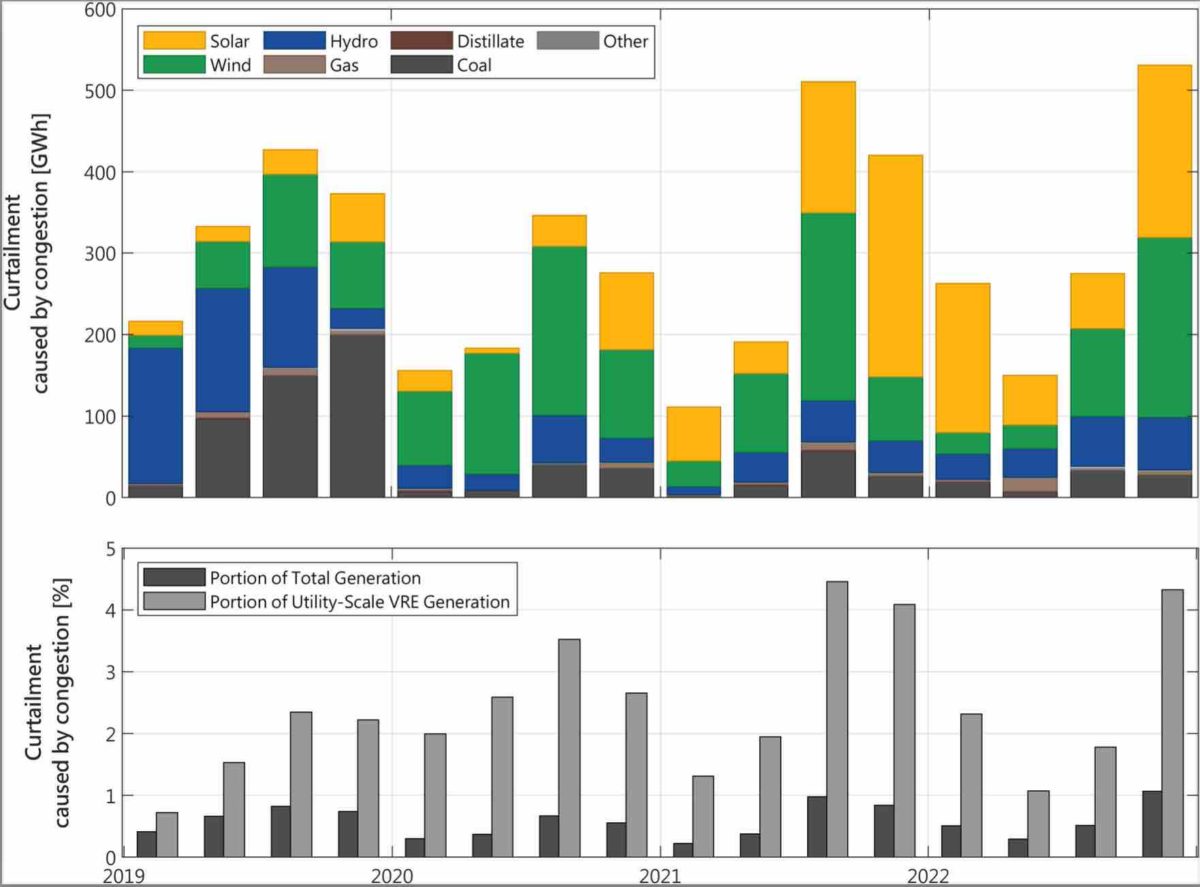
The ANU team notes that overall the level of congestion remains relatively low – just 0.3 per cent of utility scale wind and solar generation.
“We anticipate that this is lower than many stakeholders may have expected,” the authors say. But it also notes that the impact is shifting more towards renewables, which now account of 79.4 per cent of total curtailments, even while the total volume of curtailment has remained relatively stable.
The study notes that more than 10 facilities are suffering wholesale market revenue losses of more than 10 per cent – with Molong leading the way at 38 per cent – while another 16 have more than five per cent revenue losses as a result of congestion constraints.
In dollar terms, the biggest losers are existing pumped hydro stations such as Tumut 3 and Murray, which have losses of around $23 million and $18 million in calendar 2022.
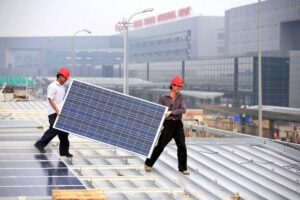
Solar is by far the worst impacted, with curtailments almost double that of the next closest in wind despite having a smaller installed capacity.

“We can observe that the majority of solar curtailment occurs in NSW, while the majority of wind curtailment occurs in SA. Notably, the curtailment of solar energy alone in the NSW market region (418 GWh) is greater than the total curtailment of any other region,” the report says.
But it also notes that the energy curtailed from solar (at an average price of $58.74/MWh) and wind ($46.34/MWh) is on average much cheaper than both that curtailed from gas ($716.69 /MWh) and coal ($169.42/MWh), as well as the average unit price of energy over this period ($140.75/MWh).
Which means that the technologies most likely to be curtailed under current arrangements are those that are cheaper and cleaner. “These findings affirm the claims made throughout this stakeholder consultation, that congestion is causing large volumes of cheap renewable energy to be curtailed,” they say.
“Curtailments of this scale denote significant financial losses for these generators, and contribute to investment uncertainty and risk for future projects,” the report says. “Across both rankings we observe that almost the entire top 40 consists of renewable generators, primarily solar and wind.”
The report notes that storage and flexible loads have great potential to provide congestion relief, and reduce the wasteful curtailment of cheap renewable energy, but it is not being fully utilised under the current market structure.
“Much of the conversation surrounding the need for a Congestion Relief Market suggests that the current market design does not incentivise storage to alleviate congestion, however the findings above seem to indicate that it often actually does.
“It is clear to see that several of the batteries do overwhelmingly bid to relieve congestion, even in the absence of an explicit incentive. This is likely because the low spot prices that incentivise charging can often occur alongside congestion as a result of a region-wide oversupply of VRE.
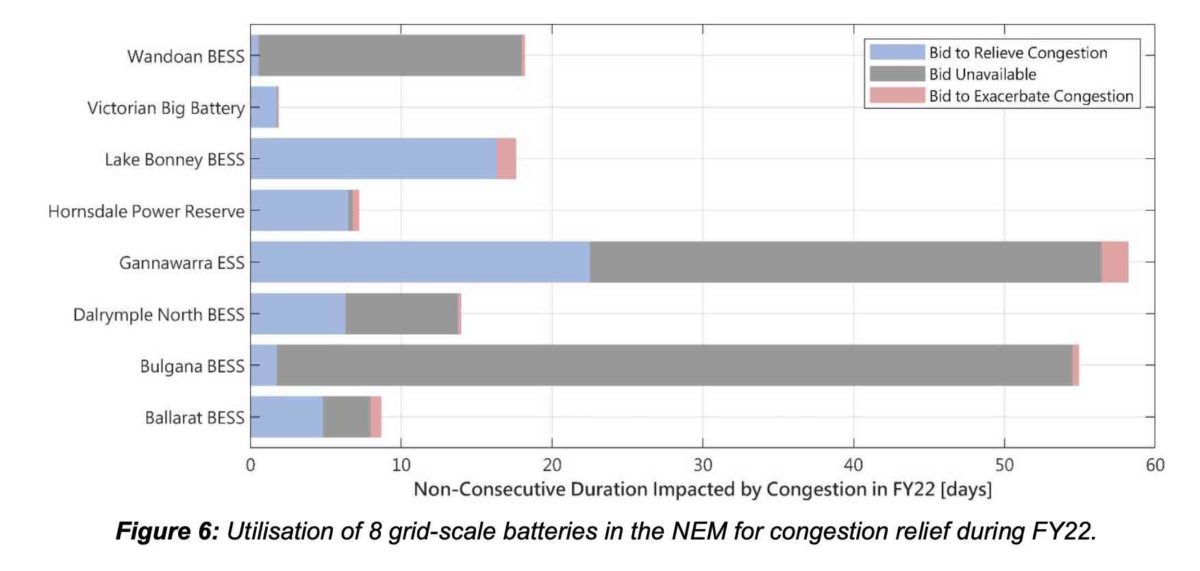
“Despite this, it is also clear that there are also occasionally times where each battery bids to exacerbate congestion by discharging. (See graph above).
“This represents the scenario referred to so frequently in much of the discourse, wherein the lack of explicit incentive allows batteries to make congestion worse.”