
The Energy Collective Group
This group brings together the best thinkers on energy and climate. Join us for smart, insightful posts and conversations about where the energy industry is and where it is going.
Post
Anomaly vs. Temperature - Perspective is important.

Originally published here.
anomaly: something different, abnormal, peculiar, or not easily classified: something anomalous
temperature: degree of hotness or coldness measured on a definite scale
Source: Merriam-Webster
The primary focus of the global warming / climate change issue has been on the anomaly of current temperatures relative to temperatures at some time, or over some period, in the past. One of the primary reasons for focusing on anomalies has been the inaccuracy of global average temperature measurements. Even if absolute temperature measurements are inaccurate, anomalies can accurately reflect temperature changes over time, as long as the conditions surrounding the temperature measurement instrument do not change and the instrument calibration remains stable. Anomalies lose accuracy when the area surrounding the instrument changes, the instrument is moved or the instrument drifts out of calibration.
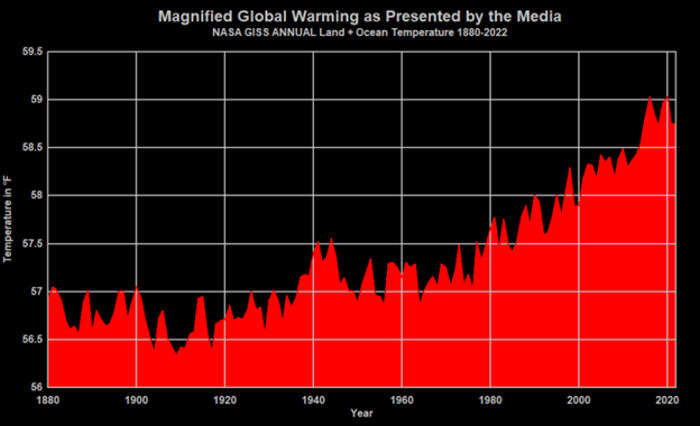
The consensed climate science community routinely “adjusts” measured temperatures to “correct’ for perceived inaccuracies in the temperature measurements; and, these “adjustments” affect the calculated temperature anomalies. The anomalies are frequently presented in graphical form with severely truncated “y” axes, which make the anomalies appear larger and the changes in the anomalies appear to be greater or occurring more rapidly, as shown in the graph below from wattsupwiththat.com.
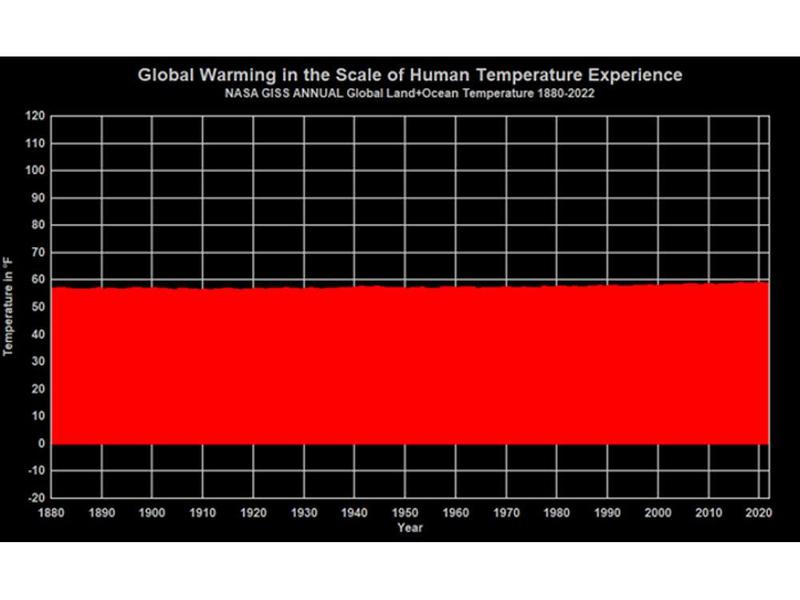
A focus on actual temperatures presents a very different picture, particularly when presented in graphical form with a “y” axis representative of the entire range of historical temperatures experienced in the area exhibiting the temperature anomaly, as shown in the graph below from wattsupwiththat.com.
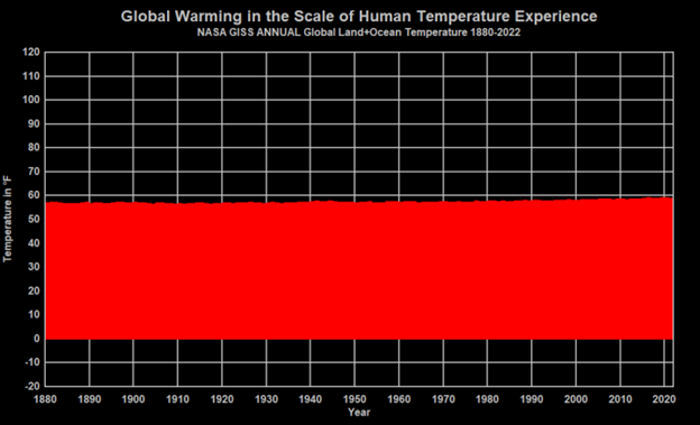
The surface temperatures on earth range from a maximum of +58°C to a minimum of – 88°C (+136°F to – 126°F). The global annual mean surface temperature is thought to be approximately 15°C (59°F), but is difficult to determine accurately because of the limited availability and coverage of temperature measuring stations and questions about the accuracy of the temperature readings from those stations. The average daily temperature range for the earth is estimated to be between 11 to 12°C (~20 to 22°F). It is in this context that we discuss global mean near-surface temperature anomaly estimated to be approximately 1°C (1.8°F) over the 140 year period since 1880.
The daily near surface temperature range of 11-12°C occurs throughout the calendar year. However, in a region with an annual mean surface temperature approximately equal to the global annual mean surface temperature, the average daily temperature in the peak summer month would be approximately 28°C (50°F) warmer than the average daily temperature in the peak winter month.
Compared to the range of near surface temperatures measured on the earth, the current global annual mean temperature anomaly represents approximately a 0.7% increase. Compared to the global average mean temperature, the current anomaly is approximately a 7% increase. However, note that the global annual mean near surface temperature is approximately 5°C below the typical control temperature of heating and cooling systems for occupied spaces. Also note that approximately 60% of the anomaly manifests as an increase in nighttime temperatures, largely as the result of the Urban Heat Island (UHI) effect and agricultural irrigation effects on atmospheric humidity.
Discussions
No discussions yet. Start a discussion below.
Get Published - Build a Following
The Energy Central Power Industry Network® is based on one core idea - power industry professionals helping each other and advancing the industry by sharing and learning from each other.
If you have an experience or insight to share or have learned something from a conference or seminar, your peers and colleagues on Energy Central want to hear about it. It's also easy to share a link to an article you've liked or an industry resource that you think would be helpful.


Sign in to Participate