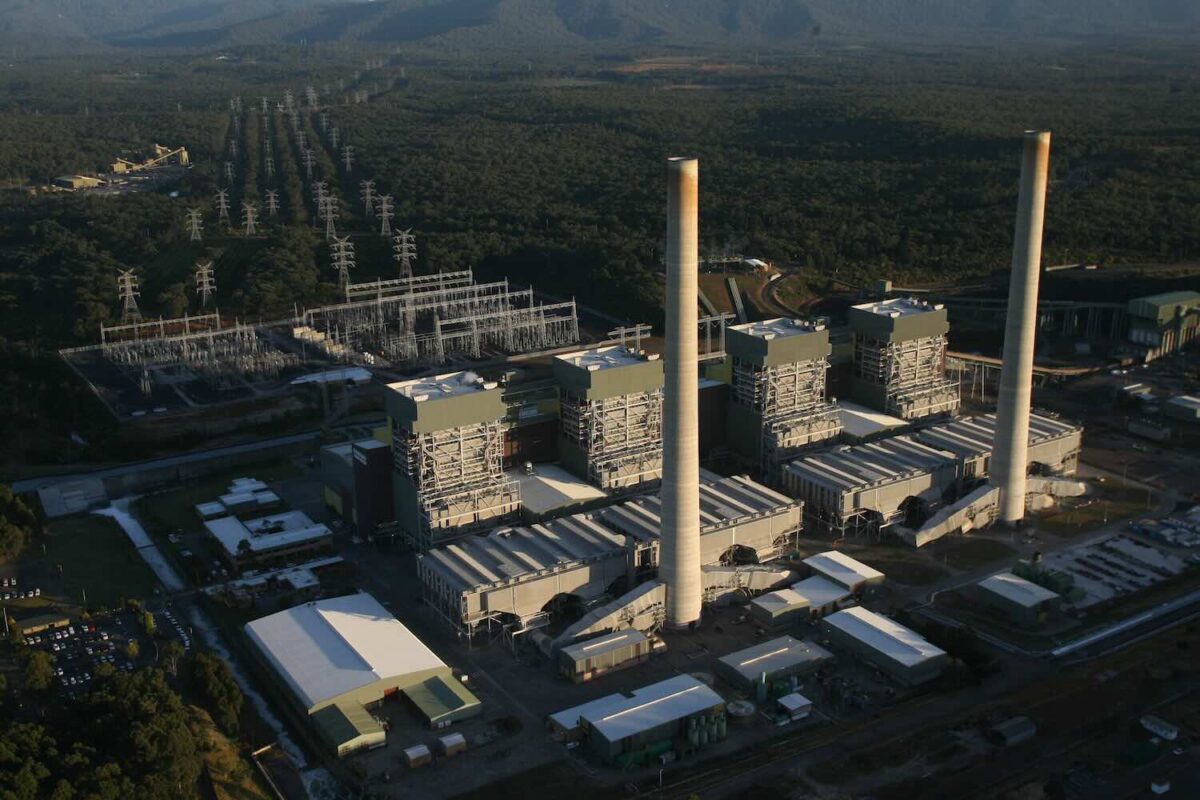
In my opinion there will not be enough new renewable supply built in NSW to fully replace Eraring by the end of 2025. In fact, I don’t think there will be enough by the end of 2027 unless some big new projects get their notice to proceed within the next six months.
There will be enough power, but power isn’t the issue, it’s energy: that is finding that power every half hour over the whole year.
New gas generation will provide firming and represents additional energy, but at a steep price.
I estimate that before allowing for any change in transmission flow, or the energy generated from Tallawarra B and Kurri Kurri open cycle (expensive to run) gas generators, or any uncommitted projects that can be fully operating by 2027, that on average NSW domestic production will be about 500 MW lower in 2027 than in the year ended March 25, 2024.
This can be made up from more imports, most likely from Queensland, because Project EnergyConnect – the new link from South Australia – will only be of limited help until the Sydney to Wagga line is decongested, and perhaps a bit from Bayswater and by running the new gas generation.
The batteries that will store the likely midday surplus and open cycle gas in the morning and evening are expensive options.
It’s much better to build more wind in NSW. There are big projects that could be started quite soon: Liverpool Range is over 1 GW, as is Delta/Yanco in the Southern REZ. However, the latter has no chance of getting power to Sydney prior to Humelink being built.
In the end the regrettable conclusion is that:
- Origin Energy has done nothing to replace its Eraring Capacity. It sees better opportunity in Octopus.
- Eraring can only be closed if imports from Queensland and South Australia can cumulatively average 500 MW higher in 2026 than in 2025. In my view this is quite possible but the imports probably can’t be the required 1800 MW higher in the morning and evening non solar periods.
- There is enough storage to store the emerging midday NSW solar surplus. There will be GWs of storage but it will cost consumers plenty to access it.
- There will not be enough storage probably to absord the entire emerging NSW surplus. Again there will be enough GW but not enough GWh. A 2-hour battery cant store a 4 hour surplus.
- NSW consumers must be prepared to put up with a lot more rather than a lot less high priced open cycle gas generation, at least until more wind is built.
- Without sufficient certainty around the Queensland imports, Eraring can’t safely be closed in August, next year. I do think the Queensland imports will be there. But I wouldn’t mind some reassurance.
Adding it all up, the lights may stay on, but at a price
On ITK’s calculations, there wont be enough energy built in NSW to replace Eraring by 2027, let alone in 2025. Batteries can shift the lunchtime surplus to the evening, but they are net consumers of energy. On my calculations there will be an average shortfall of about 550 MW before considering extra imports and the new gas generation.
The following chart shows supply in NSW for the year ended March 24, 2024, with my 2027 estimate adjusted for Eraring and all the new supply in NSW detailed above.
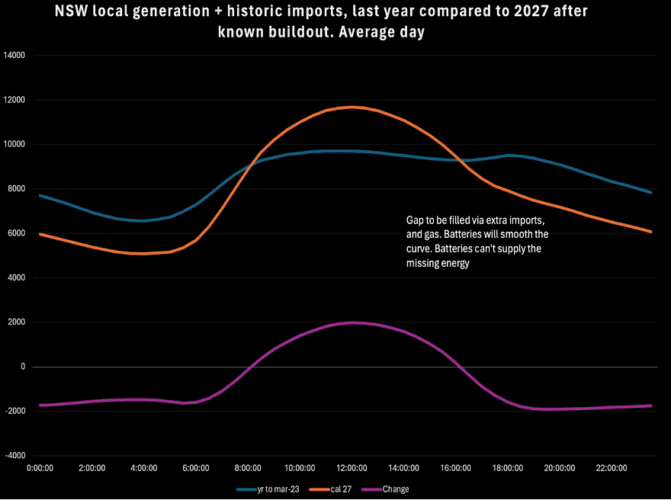
The first thing to note is the shape of the NSW supply curve becomes more variable. No surprise there.
Overall, there is a 1800 MW shortfall in the morning and the evening and a similar surplus compared to the current state of affairs in the middle of the day. But the surplus only lasts for 8/24 hours. None of these numbers allow for demand growth which by 2027 could be on average say 400 MW higher than in 2023.
That overall shortfall will be met firstly by increased imports from Qld, and if enough storage was available maybe some of the QLD midday surplus could be used to charge batteries.
Conceptually, and subject to transmission availability, I could see an average 500 MW surplus coming from QLD, or maybe 500 MW including imports from South Australia and from QLD.
But that power won’t be free, after all it has to be better value than what the producer can get locally after covering line losses etc. If the surplus from QLD comes in the middle of the day its only useful if NSW has enough batteries, and that is expensive. Far cheaper to build more wind locally.
Secondly gas generation can run harder. But that is frightfully expensive. It’s all open cycle and NSW doesn’t have the gas in the absence of Narrabri and Narrabri wont be running in the next 2-3 years, if at all.
The following sections work through the numbers. I don’t publish the individual projects but I have checked each one under construction per www.renewmap.com.au and looked up what management say about startup dates. Of course, I treat those with the same approach an auditor does when reviewing statements.
Supply, power and energy both matter
For a consumer it’s the average price that matters, as opposed to peaks or troughs. And average prices are driven by energy available over, in this case, a multi year period compared to demand.
Let’s start with power. Despite forthcoming coal closures based only on under construction its clear there will be a net increase in dispatchible capacity over the next few years.
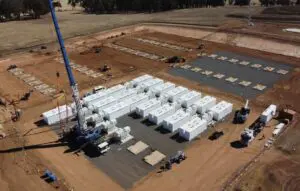
Additionally, more batteries will be built. And of course Snowy 2.0 is somewhere out there as well.
On batteries, do note that current plans call for over 3 GW of batteries to be commissioned in 2025, and some of the biggest part of that in the December Quarter.
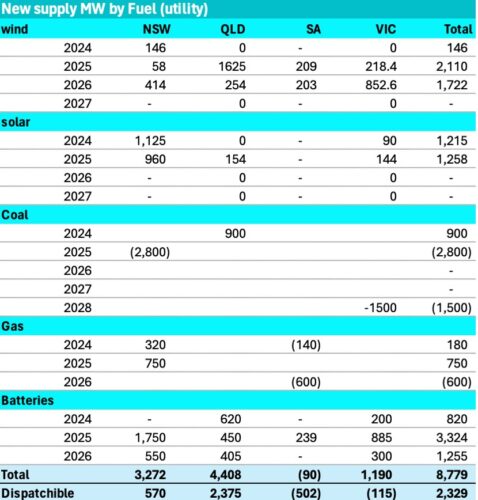
It’s odds-on some of that will slip but by how much? From a pricing persective the impact of the batteries should be quite evident by 2026. A summary of new supply by MW but excluding behind the meter is:
Equally, the withdrawal of coal generation will likely influence midday prices as much as morning and evening peaks.
Even though it ramps down coal generation has to operate continuously. It therefore operates at a loss in the middle of the day, but because it operates it increases supply and pushes lunchtime prices down, and also eats up some transmission capacity.
Finally, not all of the battery power is available for “generation”, some is reserved for transmission management or other grid services.
Energy is not so clear
The table below has optimism built in. It assumes that the energy from a unit fully commissioned in a year is actually produced/available for the whole of that year. Essentially the actual outcomes, if my forecast was correct, would be lagged on average by about 6 months.

Figure 3 changes in energy generated. Source: NEM Review, ITK
Excluding any change in gas generation and assuming no change in energy spilled, we forecast total output to increase about 13 TWh or 5% over the next four years, solely from developments under construction. The energy table does include rooftop.
It’s very clear to me from the table, that new renewable developments in NSW will not produce enough energy to compensate for the closure of Eraring.
Certainly not by the announced closure date and, in my view, probably not for at least another 18 months subsequent. Batteries are irrelevant to energy, batteries shift the time of consumption around but they are net consumers.
New developments will be announced from the CIS and elsewhere, but an announced wind farm would need notice to proceed by say June 2025 at the latest if it’s to be fully operational in 2028.
A solar farm can take 6 months less. A wind farm of any decent size, ie 200 MW or larger, that received notice to proceed today would still have next to no chance of being fully operational in late 2025 when Eraring is scheduled to close.
Other plants in NSW, but particulary Bayswater, may be able to pickup some Eraring slack. I don’t think there is enough coal to run Mt Piper a whole lot harder and Vales Point doesn’t have the capacity to do much more.
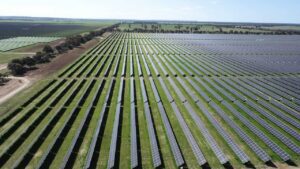
From a pricing perspective the fact that on average energy will be a bit tighter points to prices staying higher for longer. The fact that the vast marjoirty of the new supply in NSW is solar also points to higher prices .
Transmission and gas must be the answer
Despite the energy tightness in NSW and Victoria there will be a growing surplus in QLD in and South Australia.
NSW is connected to both States, although South Australia depends on Project EnergyConnect running by say the end of 2026. Probably the most natural thing though is for the extra South Australian surplus to go to Victoria once Yallourn closes and for some the Queensland surplus to flow south to NSW.
Prior to Yallourn the energy will first replace that lost by the closure of TIPS B steam gas plant and what’s left exported to NSW.
It looks like even after tidying up its own current tighness QLD should have a significant surplus to export to NSW, perhaps more than the present transmission capacity. Historically, QLD exports to NSW have not averaged over 500 MW for a full year in any of the past five years. That compares to a theoretical line capacity of about 1200 MW.
You would have to know a lot more about constraints than I do, but generously NSW imports from QLD might average 1000 MW from 2026-2028.
In 2028, I expect Gladstone to close and the forecasts will need revising. There is too much uncertainty and not enough information to make a useful forecast for the 2028-2030 period. If everything policymakers want comes to pass, then life will be wonderful from a renewable energy perspective.
Regarding South Australia, in my view Project EnergyConnect is basically useless from a NSW consumer perspective without Humelink.
We already see solar farms in Southern NSW sending power to Victoria because they can’t get it up to the NSW load. The “Sydney Ring” works may help but the better answer is Humelink. Humelink is only 500 KV double circuit, maximum capacity 3 GW.
If it was two double circuits (or considering the NSW Upper House, perhaps i should write two double circuses) then the capacity jumps to 9 GW.
And the South West NSW REZ, ie the big space between Balranald and Narrandera, has submitted plans, by reputable developers, for something like 7 GW of wind. However, that’s not the point of this article.
Note that so far we have not invoked any of the supply that may be procured from the CIS or put any such supply into the pricing mix.
Nevertheless, such supply will have an impact because its that additional supply that will enable and equally force (via revenue shortfall) more coal fuelled generation out of the NSW and QLD mix. But only the first tranche of CIS contracts, if we assume away all the issues around the CIS, has any chance of impacting supply by 2028.
The impact of new supply on the NSW average day
Average daily pool prices in the mainland NEM over the past year show negative prices in States other than NSW at lunch and then big peaks in the evening. Those peaks reflect a shortage of power in the evening. Not enough batteries which is why so much more is coming.

Over the past year, the NSW supply, demand and price average day curve looks as follows:
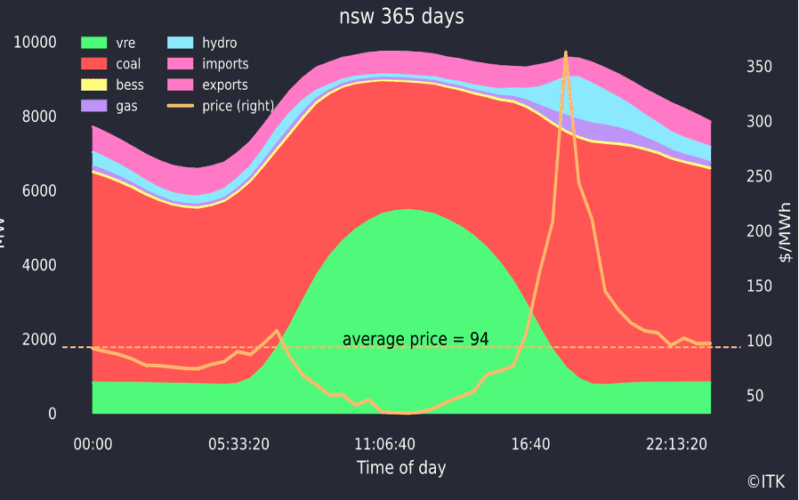
The firming capacity earns prices up around $200/MWh in NSW over the past year, whereas solar energy gets around $50/MWh.
In fact, that $150/MWh gap is not really enough for a battery. Batteries need a “spread” of about $200/MWh although that will come down as prices fall. Batteries make up the difference with mostly frequency control revenue.