Measuring Earth Dynamics With Planetary Variables
Learn how these analysis-ready data feeds can be used to measure a range of important conditions.
Earth is in a constant state of change, from natural processes like the water cycle or seasonal temperatures to human activities like deforestation or agriculture. Governments and businesses alike who are responsible for managing broad areas need to monitor, measure, and report on these dynamic systems to mitigate risk, optimize their operations, and protect the environment.
Earth observation (EO) enables organizations to manage broad areas so they can respond efficiently to changes that matter. But for use cases where you need to monitor large areas such as states or countries, not all EO data is equal. You likely need data with broad and continuous coverage and a deep archive to create a baseline to monitor against. You also likely need high-temporal frequency to monitor changes promptly.
Most importantly, you need measurements that relate to what you are concerned with monitoring. If you are looking to understand a drought’s impact on fire risk or irrigation activities impact on water resources, ideally you would use measurements of soil water content. If you are concerned with deforestation or and measurement, reporting, and verification (MRV) for carbon accounting, ideally your inputs are related to tree cover and aboveground forest carbon. And these measurements should be reliable and transparent.
Planetary Variables
Planetary Variables are analysis-ready data feeds that measure important conditions on the surface of the Earth including: Soil Water Content, Land Surface Temperature, Crop Biomass, and Forest Structure and Carbon. They draw on observations from numerous public and commercial satellite missions to generate datasets that have broad, continuous geographic coverage, high-temporal resolution, and a deep archive.
Planetary Variables can be used for a variety of purposes:
- Compare current and historical Soil Water Content to highlight areas experiencing drought to manage water resources more efficiently.
- Evaluate how Land Surface Temperature has changed to quantify the impacts of regreening efforts or to look at crop stress due to high temperatures.
- Model crop yield estimates or detect crop harvesting events through cloud–free crop monitoring with Crop Biomass.
- Measure, report, and verify on forest carbon projects with Forest Carbon Diligence.
Planetary variables are rigorously tested and validated — and you can read more about their accuracy and reliability in their respective technical specifications and scientific literature. They are designed to make Earth observation more accessible by reducing the need to build sophisticated data fusion and machine learning models that translate esoteric datasets into measurements of variables that matter.
Planet Insights Platform
To make use of Planetary Variables you need a platform to turn the data into information that solves a problem or answers a question. For example, how does this year’s land surface temperature compare to the historical average? Or where in a country has forest cover changed the most over the last several years? Such a platform should be scalable to broad areas, capable of handling statistical analysis, and be interoperable with your workflows.
To analyze these Planetary Variables you can use Planet Insights Platform, the all-in-one place for multidimensional Earth insights. The platform is cloud-based and API-first, empowering developers, data scientists, and GIS teams to host, analyze, and stream imagery at scale. Planet Insights Platform enables you to perform planetary-scale analyses with multi-temporal statistical analysis of EO data and is designed to analyze deep archives of data.
The temporal resolution or revisit rate of Planetary Variables like Soil Water Content, Land Surface Temperature, and Crop Biomass can create a deluge of data. It can be challenging to make sense of 1,000+ images or measurements over the same region. Sentinel Hub solves this with a fast and scalable Statistics API which summarizes the dataset with descriptive statistics.
Climate Anomaly
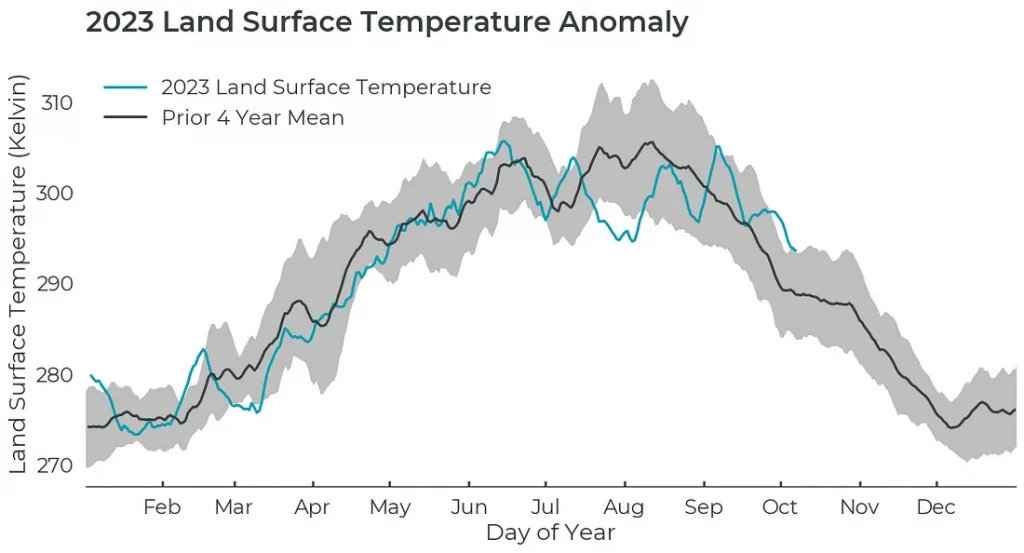
A common type of analysis for Planetary Variables is to look at how much current year values deviate from historical means, commonly referred to as the anomaly. Sentinel Hub’s multi-temporal statistical analysis tools allow you to efficiently extract statistics from deep time stacks of data using cloud processing.
For example, the chart below shows how the current year’s Land Surface Temperature compares with the prior four-year average. The land surface temperature was colder than usual at the end of February and beginning of March, when compared to the prior years. For agriculture, soil temperature is an important variable for crop emergence. For urban areas, this can highlight areas of urban heat islands.
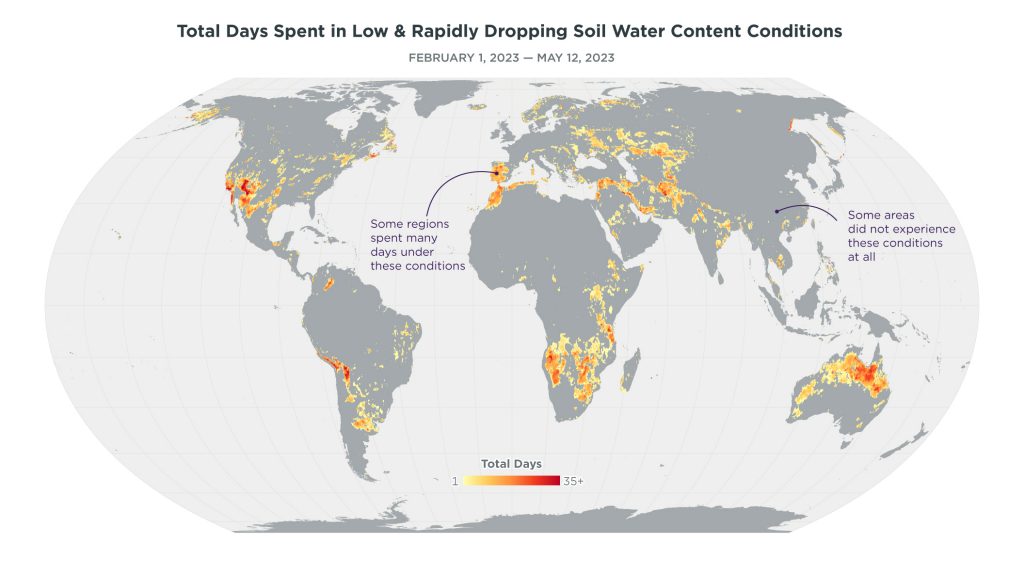
This time series chart represents a specific place and how the current year relates to previous years. What would happen if you applied this analysis across broad areas? You could identify geographical locations experiencing statistically significant anomalies from mean temperatures or water content. For example, this globe shows regions spent in low and rapidly dropping soil water content conditions. You can read more about our analysis here: Flash Drought Hotspots — Iberian Peninsula.
How it Works
Performing analysis like this climatology example can be done with Planetary Variables inside Planet Insights Platform. It works like this:
- Planetary Variables data is hosted in the Planet cloud — ready to be analyzed by our processing and statistical APIs.
- You use and customize scripts which determine how data is rendered on maps and calculated in statistics.
- Leveraging the Sentinel Hub Python SDK, you can integrate these analytics into data sciences workflows or a data pipeline you are building to integrate into your solution.
- You can iterate over small areas until you are ready to scale your analysis across broad areas with batch processing capabilities.
Learn More About Planetary Variables
Planetary Variables make monitoring a dynamic Earth and managing broad areas feasible through analysis-ready insights into measurements that matter.
No longer do you need to build your own machine learning models or build complex imagery management systems — just start analyzing reliable data at scale with the multi-temporal data analysis tools available in Sentinel Hub.


)