The Big Picture: A U.S. Hydropower Profile (Infographic)
The U.S. conventional hydropower fleet includes 2,252 hydropower plants with a total generating capacity of 80.58 GW, which produced 6.2% of the country’s electricity in 2022 and nearly 30% of all renewable generation. In addition, it has 43 pumped-storage hydro (PSH) plants, a combined capacity of 22 GW, and an estimated energy storage capacity of 553 GWh.
Source: Megan M. Johnson, Shih-Chieh Kao, and Rocio Uria-Martinez. 2023. Existing Hydropower Assets (EHA) Plant Database, 2023. HydroSource. Oak Ridge National Laboratory, Oak Ridge, Tennessee, USA. https://doi.org/10.21951/EHA_FY2023/1972057
According to the U.S. Department of Energy’s (DOE’s) September 2023–issued U.S. Hydropower Market Report, conventional U.S. hydropower capacity increased 2.1 GW between 2010 and 2022. PSH capacity increased 1.4 GW over the same period, though 97% were capacity upgrades to the existing fleet. The report notes that PSH provided a median storage duration of 12 hours—much higher than the median storage duration of the country’s 445 utility-scale battery installations, which stood at two hours.
However, capacity investments, investments in refurbishments, and upgrades in U.S. hydropower have slowed in the 2020s, relative to the 2010s. “These declines might be partially explained by COVID-19 restrictions and supply chain challenges that resulted in delays and cost increases; in the case of U.S. imports of hydraulic turbines and turbine parts, the decrease in activity starts in 2019 and was likely influenced by U.S. import tariffs,” the DOE says. Hydropower incentives authorized in the Bipartisan Infrastructure Law (BIL) and the Inflation Reduction Act (IRA) tax credits “are expected to stimulate investment in upgrades to the existing fleet and construction of new hydropower and PSH projects in the coming years,” the agency notes.
At the end of 2022, 117 new facilities were in the development pipeline—a combined capacity of 1.2 GW. Nearly half (56) had received authorization from the Federal Energy Regulatory Commission (FERC) or Bureau of Reclamation. However, only eight of them (14 MW) had started construction. Meanwhile, 96 PSH projects were in the development pipeline. Most have closed-loop configurations, which allow more siting flexibility.
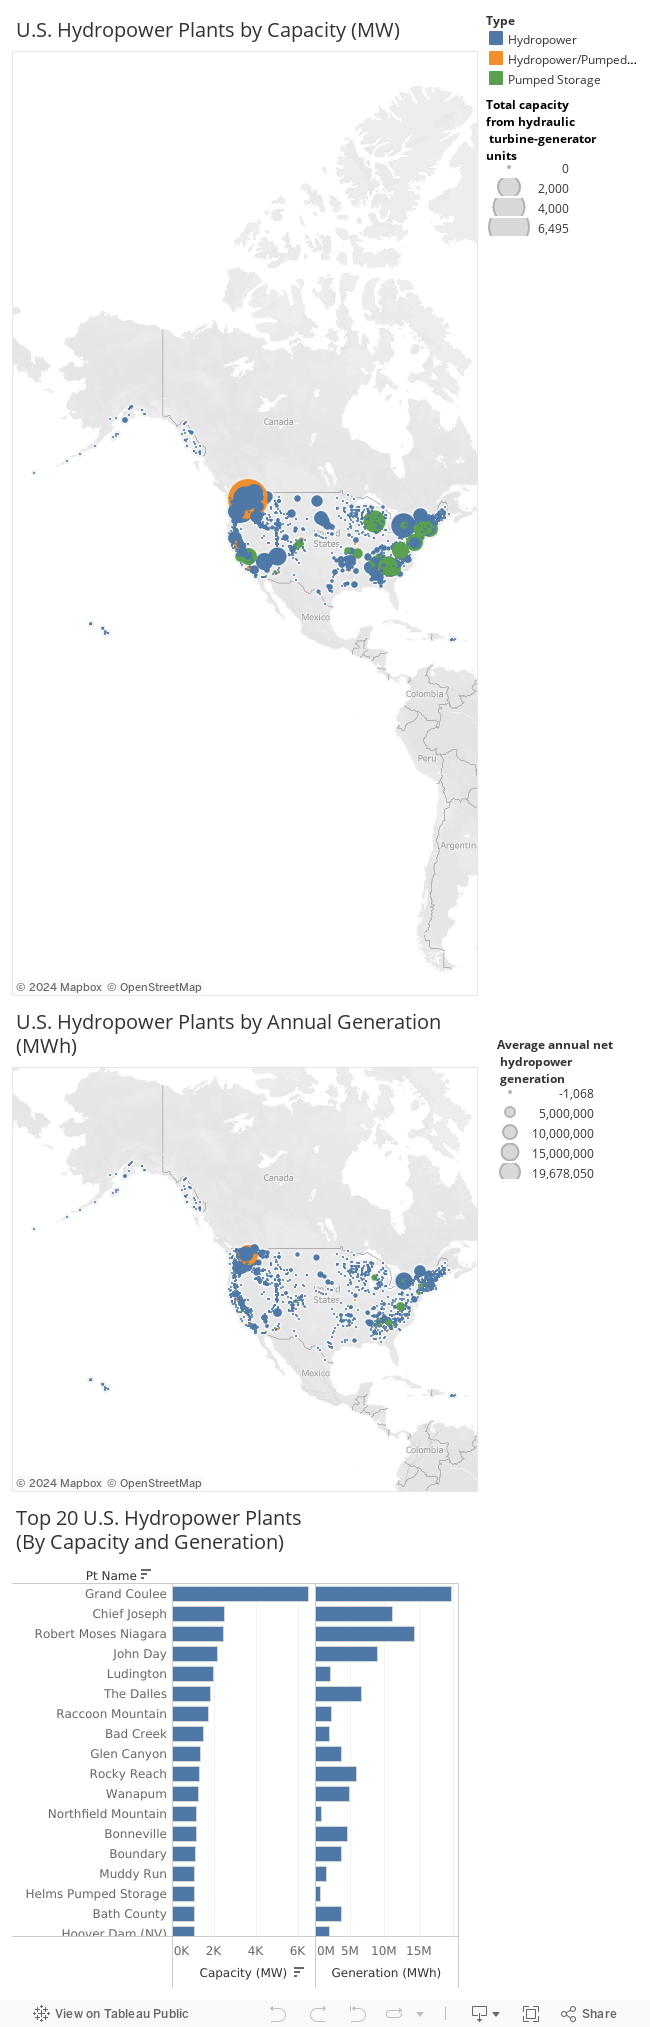
Five Largest Hydropower Facilities
1. Grand Coulee (6.2 GW from 33 units): an intermediate plant in Grant County, Washington, owned by the Bureau of Reclamation. Its operation began in 1941.
2. Chief Joseph (2.5 GW from 27 units): Opened in 1955, the Douglas, Washington, plant is operated by the U.S. Army Corps of Engineers (USACE).
3. Robert Moses Niagara (2.5 GW from 13 units): a run-of-the-river plant in Niagara, New York, owned by the New York Power Authority. Operation began in 1961.
4. John Day (2.1 GW from 16 units): a run-of-the-river plant in Sherman, Oregon, operated by the USACE. It began operation in 1968.
5. The Dalles (1.8 GW from 24 units); a run-of-the-river plant in Wasco, Oregon, operated by the USACE . Its operation began in 1957.
Five Largest Pumped Hydro Storage Facilities
1. Bath County (3.7 TWh from six units): Owned by Virginia Electric Power & Co. It began operation in 1985.
2. Raccoon Mountain (2.3 TWh from four units): A Tennessee Valley Authority project in Hamilton, Tennessee, that began operation in 1978.
3. Ludington (2.2 TWh from six units): : A Consumers Energy project that began operation in 1973.
4. Bad Creek (2 TWh from four units): Owned by Duke Energy Carolinas, the Oconee, South Carolina, project began operation in 1991.
5. Muddy Run (1.5 TWh from 8 units): Constellation’s project in Lancaster, Pennsylvania, began operation in 1967.
—Sonal Patel is a POWER senior associate editor (@sonalcpatel, @POWERmagazine).