Load forecasting has always been a mission-critical discipline for energy providers. Accurate demand forecasting enables critical utility functions ranging from purchasing energy at a lower cost, avoiding black and brownouts, developing dynamic rate structures and implementing more effective demand response programs.
But as the grid grows exponentially more complex, accurate demand forecasting is becoming more challenging, and a greater imperative, than ever before.
Distributed energy resources like solar and wind are shifting the predictability of energy generation, while an increasing number of consumer electric vehicles (EV) and large-scale EV fleets are introducing more variability and greater peaks on the demand side.
Thankfully, new AMI data is at the same time expanding and improving the accuracy of the insights energy providers are able to draw upon as part of their grid planning process. AMI analytics enable more accurate predictions of future load patterns, more effective grid-stabilizing customer behavior strategies and more successful management of distributed energy resources.
Top-Down vs. Bottom-Up
Historically energy providers have only been able to evaluate energy usage at the substation level, or in some cases, at the feeder level.
Now, by applying AI to smart meter data, utilities are empowered to understand load at the per-home or per-appliance-use level. While all usage may look the same at the substation level, it’s certainly not the same at the home level.
Applying AI to smart meter data, energy providers can define the foundational building blocks of service territory energy use: the consumption of individual appliances within a home. This bottom-up approach to grid management enables a deeper and more granular understanding of usage.
Granular Data to Inform Big Picture Strategies
AMI-derived household energy use data enables energy providers to cost effectively create highly accurate and comprehensive appliance-level energy use profiles for every residence. These profiles reveal essential load research data inputs, including such things as:
- Which homes have EVs and who is charging during peak hours
- Which homes have inefficient or degrading HVAC systems
- Which homes have pool pumps and whether they are single or variable speed
- Insights into appliance health
For example, as soaring temperatures strain grids across much of the northern hemisphere, a precise understanding of HVAC and pool pump usage and appliance health can inform impactful demand response programs that effectively engage customers to better reduce load.
NV Energy approached demand response with these goals in mind.
“We ran into some really good opportunities to target our customers and get the most value out of our customers based on AI-powered intelligence that told us when specific appliances were using more energy than their neighbor’s appliance or than a properly functioning appliance should have been,” explains NV Energy’s DSM Program Delivery Manager Adam Grant. “Maybe there was something wrong with their air conditioner, or we could tell that they had a single speed pool pump vs. a variable speed pool pump. Those insights gave us an opportunity to offer a solution to customers who either have a problem or who don’t have the equipment that is most optimal or most efficient. We could take what we knew about precisely where and why they were inefficient and try to help them become more efficient.”
Using Bidgely’s Analytics Workbench bottom-up load research and customer targeting capabilities, NV Energy piloted an HVAC efficiency program that identified 50,000 customers not already engaged in a utility program who would benefit from HVAC replacement based on certain high HVAC energy usage patterns.
Based on the success of the HVAC program, NV Energy built a similar Energy Efficient Pools and Spa program. Analytics Workbench was used to disaggregate AMI data to reveal pool pump appliance ownership and consumption and identify single speed pool pump owners who had the highest savings potential. The utility targeted this group with outreach to encourage upgrades to more efficient devices. At the same time, they sought to identify which homes were running their pool pump during peak hours as priority targets for the utility’s load shifting initiatives.
“There are 200,000 pools in southern Nevada and only 20 percent of them are efficient so far,” explains Grant. “So we used household energy use data to identify the most inefficient pools with high energy usage pool equipment. We targeted those 75,000 residential customers, telling them, ‘You seem to be using a lot of energy for your pool, we can help you.’ It was incredibly successful.”
Aggregating Appliance-Level Energy Use Data to Realize Segment-Level insights
Appliance-level insight building blocks can then be aggregated to provide actionable intelligence at both the customer-segment and grid-asset-levels -– such as in connection with a specific feeder or substation.
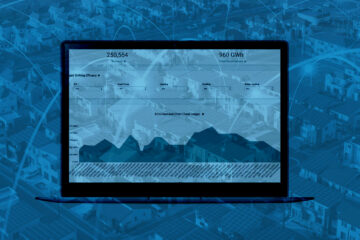
Bidgely worked with one utility in the Pacific Northwest to leverage disaggregation to map all of its customers to grid assets — first to specific feeders, and then those feeders to substations. The utility’s goal was to assess whether its existing feeder mapping would be able to withstand additional DERs, or if it should consider reconfiguration. Starting by disaggregating the energy use data for every household in the service territory, Bidgely empowered the utility to visualize the load on each of its feeders and other assets, and then assess whether any of the customer sets should be moved to a different feeder to optimize grid operation. This bottom-up approach to load research revealed essential grid management strategies to improve resiliency and avoid unnecessary infrastructure upgrades.
Iteratively Identifying Trends
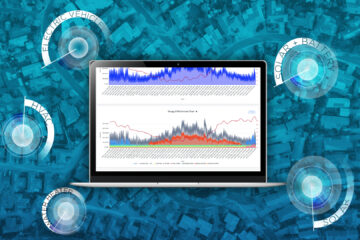
Real-time, AI-powered customer energy use data analytics capture essential aspects of a customer’s energy use behaviors over time, and reveal the variation in customer behavior or occupancy at different points during the year. Customer profiles reflect current household conditions and how they have changed from one month to the next, including the impact of unexpected environmental and societal events.
The ability to track customer energy use on an ongoing and iterative basis makes it possible to identify emerging and growing trends before they impact grid operations to enable more accurate and strategic planning.
For example, in the case of electric vehicle grid planning. AI-powered data visualization allows teams to pinpoint where constraints may exist or develop.
Harnessing Bottom-Up Planning Potential
The grid is only going to continue to grow more complex in the years and decades ahead. Those utilities that can tackle this complexity with tools to simplify grid management will remain the most nimble in the face of change. By turning appliance-level energy consumption data into actionable intelligence, utilities can predict future load patterns, encourage grid-stabilizing customer behaviors and successfully manage distributed energy resources.
Learn more about bottom-up grid planning practices by downloading Bidgely’s AI-Powered Data-Visualization Playbook for Load Research and Grid Planning.