Using planetary forensics to visualize historic drought in the Horn of Africa
Authors: Steve Levay and Ryder Kimball
Special thanks to: Arjan Geers, Max Borrmann, Tessa Kramer, Robin van der Schalie, and Megan Zaroda
Record low rainfall has pushed the Horn of Africa into a disastrous drought that is precipitating a humanitarian crisis. Water is a limiting factor for habitability: a season with little rainfall is catastrophic, six in a row is practically unimaginable. In the Horn of Africa, millimeters could be the distance between life and death.
The story in numbers is grim: rainfall 40 – 70% less than the normal average, millions displaced, and tens of millions already declared highly food insecure. Statistics can’t adequately convey the enormity of suffering, but making decisions based on the most accurate data available can help relief efforts and lend some control over the situation.

For example, we can use “planetary forensics” like measuring the amount of moisture in soil to give us a clear environmental signal about the conditions in dry regions. Based on initial models run by Planet, the Soil Water Content (SWC) data shows the recent drought in the Horn of Africa consistently has the lowest levels of moisture in the past decade, with two prolonged periods of extreme dryness coinciding with the 2021 fall and 2022 spring rainy seasons.
Understanding the ebb and flow of water in the Horn of Africa can help to gauge the severity of drought and get ahead of widespread famine. The current multi-year drought coincides with the La Niña climate system, which typically reduces rainfall in the Horn of Africa while increasing it elsewhere like Southeast Asia.
These fluctuations are normal, but climate change is intensifying the severity and duration of drought. The global weather systems that parch one area and pour on another fall beyond human control. But better tools to map and measure its impacts can equip governments, international relief efforts, and the private sector with better information to guide action.
Planet’s SWC data can be used to provide near-real-time measurements of soil moisture that are more accurate than standard models, like the one based on precipitation totals, which have difficulty when modeling water loss due to evaporation and surface runoff. To inform its Planetary Variables products, Planet uses data collected by satellites launched and maintained by NASA, ESA, and JAXA that employ passive microwave data to calculate the percentage of water present in the top layer of the soil at enhanced resolution.

These measurements create precise visualizations, available globally, like what you see above. By associating the values of the data with colors, maps made of a grid of pixels are rendered at the planetary scale. This in turn helps visualize water levels as they fluctuate over time. And they can quantify the effects of dryness with remarkable granularity when near-real-time measurements are compared with historical baselines. The data exposes areas particularly hard hit by drought, which can then be studied in closer detail.
SWC data from the Horn of Africa shows an alarming picture. In March, the region entered its 6th consecutive rainless rainy season. It’s the longest and most damaging dry spell compared to the past 70 years of precipitation data. Future climate patterns are uncertain and rainfall amounts are unpredictable. But often the best way to understand future trends is to dig deep in the past.
The Horn of Africa experiences two rainy seasons a year: the first from March to May and the second from October to December. As you can see in the graph below, these periods of above average rainfall are reflected in the gray band, which shows the 10-year historical range for Planet’s SWC analysis. The black line represents a historical baseline average over that time period called “climatology,” and the teal line shows last year’s 20-day average.

The SWC data shows the recent drought consistently has the lowest levels of moisture in the archive, with two prolonged periods of extreme dryness coinciding with the 2021 fall and 2022 spring rainy seasons. And even when SWC wasn’t at its lowest, the recent values remained consistently below the historical average.

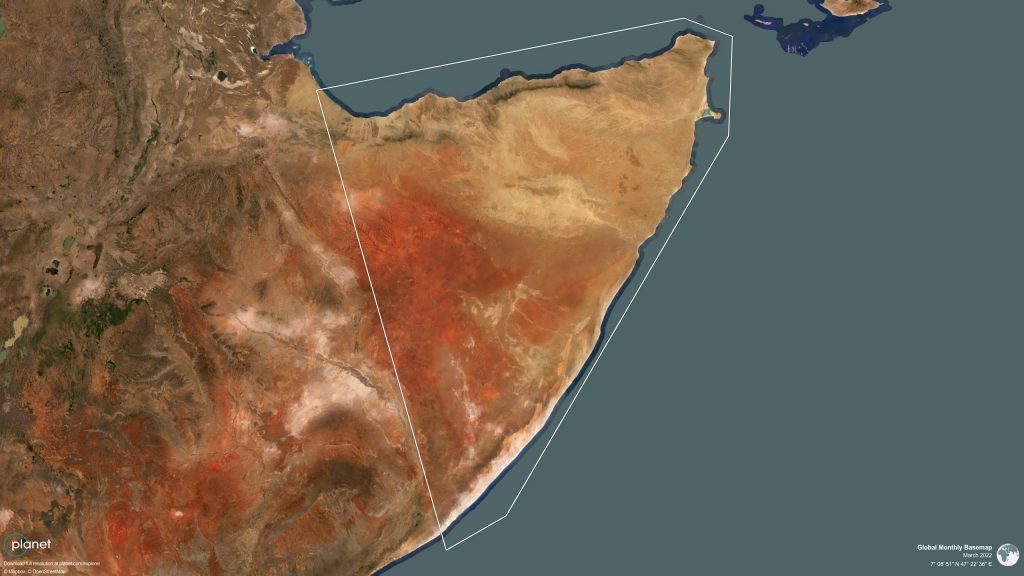
Multiple crises are converging to create a national emergency in Somalia, notably political instability, rising food prices, and drought. Dry conditions have displaced 1.3 million Somalis (nearly 8% of the country’s population) since the beginning of 2021, with another report estimating 43,000 excess deaths attributed to drought in 2022. It’s markedly worse than the country’s 2017-2018 drought that killed 31,400, and SWC data shows that the 2022 values are abnormally low, despite some improvement towards the end of the year.

International efforts are racing to provide humanitarian aid to nearly 8.5 million Somalis in need of assistance. The U.N. resident coordinator for Somalia has called for data-based findings as officials work to alleviate the drought’s impacts. We are seeing examples of this already, with organizations like the World Bank working with reinsurers to create drought risk protection programs informed by satellite data.
The Horn of Africa might get some relief as this year’s swing of La Niña to El Niño could bring more rainfall. But the global weather patterns that determine the fates of billions remain largely unpredictable, unstable, and out of human control. What can be done, however, is to leverage all available tools to better grasp the climate’s uncertainty, to compare historical archives with near-real-time measurements to map its changes, and to make informed decisions based on the most accurate data possible.


)