The traditional spring ramp-up in gasoline prices is underway, providing context for understanding why persistent claims of large gasoline price impacts from the Climate Commitment Act are misleading. Gas prices are going up (as they always do this time of year) while the CCA auction prices dropped by 50%. Opponents of the Climate Commitment Act have blamed the program for high gas prices, but what’s really driving the cost of fossil fuels? After 14 months and 5 regular auctions of the Climate Commitment Act, we offer an updated analysis on the Cap-and-Invest program’s impact on gasoline prices, showing that inflated claims often quoted of 50 cents per gallon are measurably inaccurate.
So, what is the truth?
Last September, in an article titled “Do Climate Commitment Act allowance prices get passed through to the pump?” we established a fact-based, dependable baseline expectation for monitoring the price signal of the Climate Commitment Act (CCA) at the pump. In that article, we presented our findings that the most reliable methodology to estimate the gas pump impact of the CCA is a comparison of changing gas prices in Washington relative to Oregon. This gap reflects the amount fuel suppliers are passing through to consumers and is consistent with partial pass-through of compliance costs. That price comparison was remarkably consistent in 2023 before recently declining to 13 cents per gallon as allowance prices decreased to start year two in a manner consistent with previous Cap-and-Invest systems. In a new Clean and Prosperous Institute article, we update our September analysis with another 6 months of real-world data.
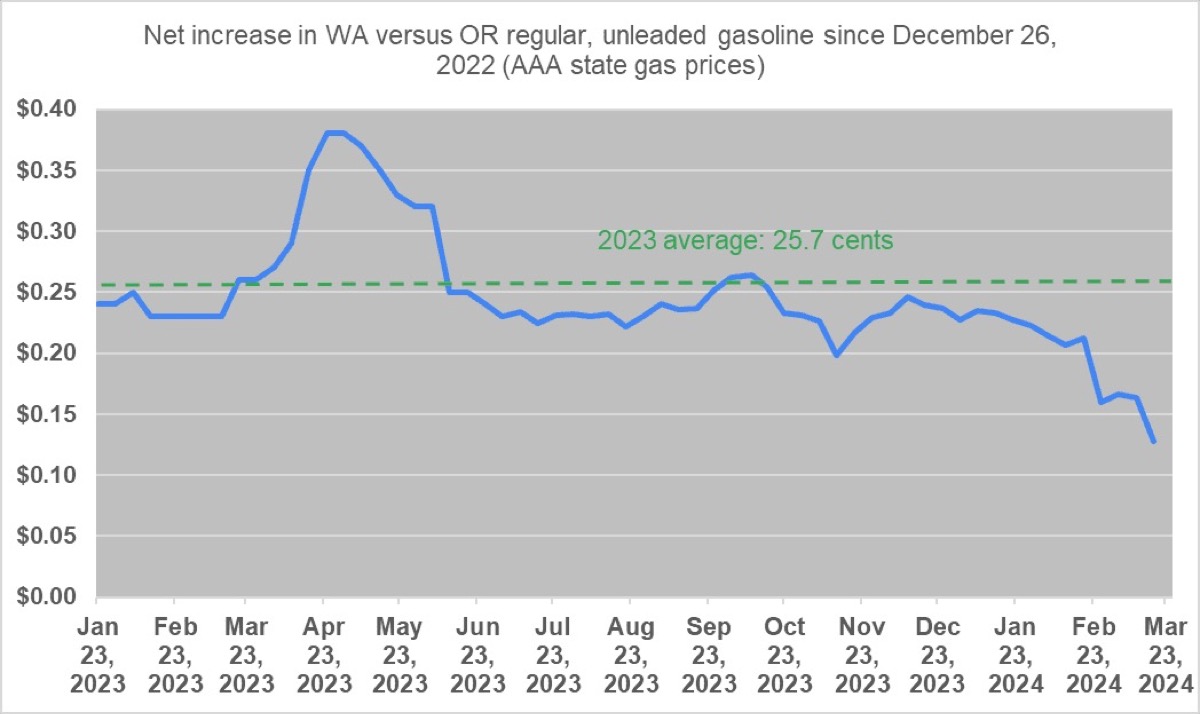
Comparison of increase in Washington versus Oregon gasoline prices relative to late 2022, using a weekly Monday tracking of AAA data between January 23, 2023 and March 18, 2024.
The best real-world comparison shows a 13 cent impact this week: We have found that the most reliable and accurate measure of the CCA’s impact at the pump is the relative price differential compared to Oregon. Historically, gas prices in WA and OR track closely together, as the two states share supply chains. For 2023, that relative difference was 25.7 cents per gallon more than the historic differential of 11 cents per gallon. To start 2024, it has been even lower: 20.6 cents per gallon through the first eleven weeks of the year, and just 16 cents starting in late February. It was down to 13 cents as of Monday, March 18th, proportional to the decrease in CCA auction prices to start 2024 and reflecting partial pass-through of allowance prices. For a less efficient than average (22 mpg) vehicle with above-average annual usage (15,000 miles per year), a 13-cent per gallon increase translates to 24 cents per day in added fuel costs.
The claim of 50 cents per gallon impact is inflated and measurably inaccurate: Many claims abound that 50 cents per gallon was (and continues to be) the impact of the CCA at the pump. However, this fallacy relies on a snapshot cherry-picked from a moment in time last year and is based on an inaccurate assumption:
- Snapshot: Comparisons between Washington and other West Coast States using US Energy Information Agency (EIA) data showed a temporary relative spike in Washington prices of 49.2 cents per gallon in July, 2023. However, a full year of data using that metric shows July as an outlier and not a reliable indicator. The full year average (including July) was just 13.4 cents per gallon – yet 50 cents per gallon continues to be frequently cited by opponents of the CCA as documented in the full article.
- Inaccurate assumption: A 50 cent per gallon impact would indicate that allowance prices are more than fully (116%) passed through to the pump. An average of $53 allowance price in 2023, translates to just under 43 cents per gallon based on the carbon intensity of gasoline.[1] Full pass-through is the core assumption embedded in “cap-at-the-rack” calculations and receipts. Recent and evolving research of other carbon pricing programs – documented in our September article – indicates that carbon prices, unlike direct fuel taxes, tend to be less than fully passed through to the end-consumers. Real-world comparisons of WA and OR prices at the pump support these findings.
The Climate Commitment Act has likely had some impact at the pump in its first year, although a much more moderate impact than those opposed to the program have claimed. Their inflated claims misrepresent the truth.
So, what are the consequences?
The power of the CCA is that it offers an unprecedented chance to decouple our economy from volatile fuel prices. It’s a policy that drives down emissions while making polluters pay for investments in carbon emissions reduction and air quality improvement programs. While fuel suppliers pass through a portion of their compliance cost, Washington residents and businesses benefit from the full amount of auction revenues that are invested in climate priorities, like clean air, electrified transportation, energy efficiency and wildfire prevention — all with an emphasis on local jobs. And all at risk if opponents of the CCA, with their pumped-up claims of pump price pressures prevail.
—
[1] We use the average of all allowances sold in 2023 (41.45 million) which averaged $53.10. If looking only at those generating revenue for the state and excluding those that are consigned (retained by utilities for specified use), the 2023 average was $52.39 per allowance.
