In June, the Energy Institute released the 2023 Statistical Review of World Energy. As explained in previous articles, this was formerly the BP Statistical Review, but BP has handed this off to the Energy Institute going forward.
The Review provides a comprehensive picture of supply and demand for major energy sources on a country-level basis. Each year, I do a series of articles covering the Review’s findings.
In two previous articles, I discussed the trends in global carbon dioxide emissions, as well as the overall highlights of the Review. Today, I want to cover the production and consumption of petroleum.
Defining Oil
It’s important to note that the Review lists several categories of oil production. When the Energy Information Administration (EIA) reports U.S. oil production, they are reporting crude oil plus lease condensate. The latter consists of light liquid hydrocarbons recovered in the field at natural gas wells. These are mostly hydrocarbons in the gasoline and higher range, and they normally enter the crude oil stream after production.
Another category that may be lumped into oil production is natural gas liquids (NGLs). These are hydrocarbons that are separated out at natural gas processing plants. These hydrocarbons do overlap with the lease condensate hydrocarbons, but they include lighter hydrocarbons like ethane, propane, and butane, whereas lease condensate consists of primarily pentane and higher hydrocarbons.
The Review reports oil production as the total of crude oil, lease condensate, NGLs, and oil sands. However, they report a separate category of crude oil plus condensate, which would be consistent with the EIA’s definition of oil production.
Overview
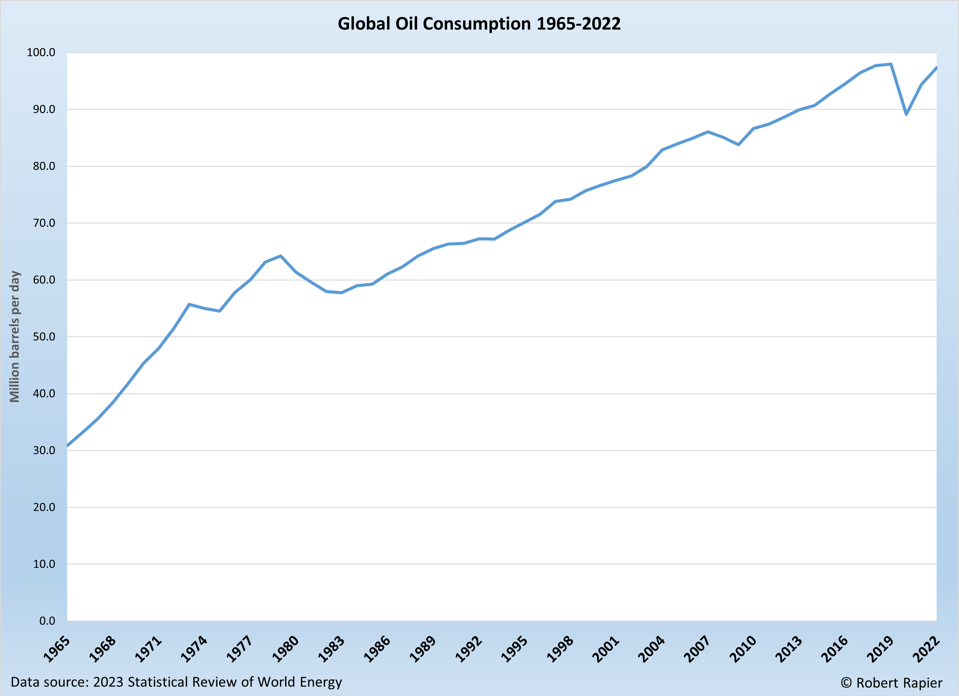
For 2022, the Review reported 2022 global oil production (which includes lease condensate and NGLs) of 93.8 million barrels per day (bpd). This was about one million bpd short of the all-time high set in 2019, but this was 3.8 million bpd higher than 2021 production.
Consumption was reported to be 97.3 million bpd. Total liquids consumption — which includes biofuels — was reported at 100.3 million bpd, once more just short of the 2019 record and 3.1 million bpd higher than in 2021.
The Top Producers
In both the conventional categories of crude plus condensate — as well as the category that includes NGLs — the United States was the world’s top oil producer in 2022. The U.S. took the top oil producer title from Saudi Arabia in 2014, and has held it in all but one year since. U.S. production in 2022 was just 3.5% short of the record set in 2019 and is on pace to set a new production record this year.
Here were the Top 10 producers of crude plus condensate in 2022:
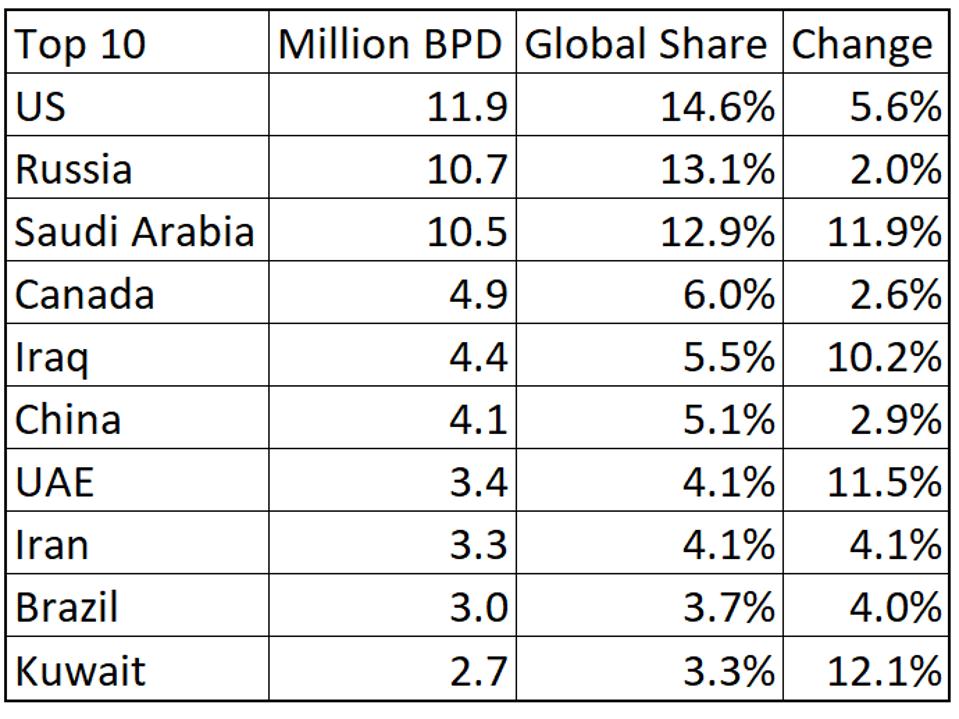
“Change” reflects the percentage change from 2021.
Although the U.S. enjoys a lead over Saudi Arabia and Russia of just over a million bpd, that lead is far greater when NGLs are considered. With NGLs included U.S. production in 2022 was 17.8 million bpd. That’s 5.6 million bpd ahead of Saudi Arabia, and 6.6 million bpd ahead of Russia’s numbers in that category. This is a function of the massive increase in U.S. natural gas production over the past two decades, which resulted in a large increase in U.S. NGL production.
The Top Consumers
The United States also remained the world’s top oil consumer, averaging 19.1 million BPD in 2022. China was second at 14.3 million BPD and was the only country in the Top 10 to report a decrease in oil consumption from 2021. The average consumption increase among the Top 10 was 4.6%.
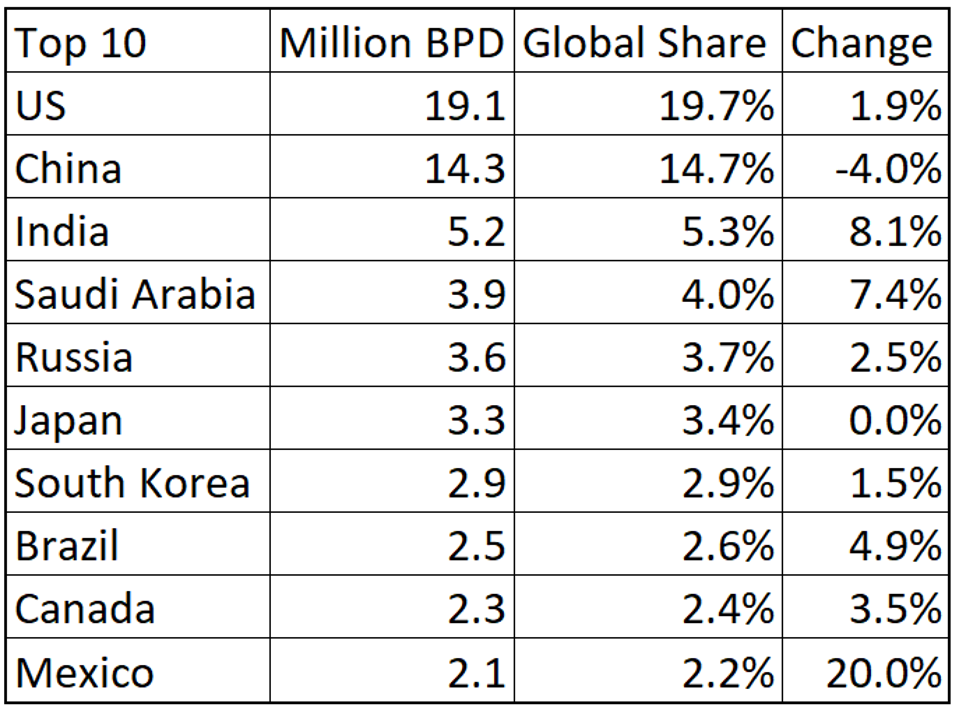
The biggest change in this list compared to recent years is that Germany fell out of the Top 10, and Mexico jumped onto the list after a huge 20% consumption increase over 2021.
Soaring Crude Prices
The Review reported that Brent crude prices averaged $101.32 per barrel in 2022, and West Texas Intermediate (WTI) averaged $94.58. Both prices were about 40% above the 2021 average, and in both cases represented the highest average annual oil price since 2013.
Conclusions
In conclusion, the 2023 Statistical Review of World Energy sheds a comprehensive light on the intricate dynamics of global petroleum production and consumption. The United States’ prominent position as a leading oil producer and consumer underscores the ongoing shifts in the industry.
With Brent crude and WTI prices reaching the highest levels in a decade, it is clear that the world of energy remains a dynamic and influential force that shapes economies and policies alike. As we move forward, a deeper understanding of these patterns and trends will be crucial in navigating the complexities of the global energy landscape.
Follow Robert Rapier on Twitter, LinkedIn, or Facebook