Planet Data Helps Scientists Track the Impacts of Natural Disasters
Natural disasters pose a threat to life, infrastructure and natural resources in mountainous regions. From 2004–2017, there were nearly 5,500 landslides worldwide, resulting in the loss of nearly 60,000 human lives. In the U.S. alone, landslides cause $2–4 billion in damages annually.
As a part of an effort to help us better understand, prepare and respond to landslides, an international group led by Sepideh Tavakkoli Piralilou at the University of Salzburg utilized PlanetScope data in combination with satellite-based radar and airborne LiDAR to train machine learning algorithms to automatically identify landslides in the Himalayas. They gained access to PlanetScope through Planet’s Education and Research program, which offers non-commercial data access to researchers.
They chose the Himalayas as their focus area as large earthquakes hit the region frequently, repeatedly triggering massive landslides that can result in hundreds of lives lost and significant economic damage each time. In particular, they looked for landslides triggered by a magnitude 7.8 earthquake that hit Nepal in April 2015. This quake resulted in nearly 200 landslides, killing approximately 9,000 people and injuring 22,000 more.
PlanetScope allowed these researchers to detect landslides that were unable to be mapped in the field because of the extremely rugged terrain. They created Normalized Differential Vegetation (NDVI) maps using the combination of PlanetScope RGB and near-IR bands, allowing them “to better distinguish between landslide and non-landslide events,” the study authors state in their paper. Using a combination of machine learning algorithms rather than just a single approach—as most researchers have done previously—they were able to create models with nearly 90 percent accuracy.
Piralilou’s study helps emphasize how data fusion unlocks more information and potential than any single data source alone. Models like these can be expanded to larger geographic areas, allowing a better look into the contributing factors behind landslides around the world. Understanding the complex variability between weather and climate over time in particular will help to improve models of landslide occurrence and impact, which can help inform organizations and governments responding to the crisis.
Understanding where landslides are mostly likely to occur can help local governments and populations better prepare with infrastructure and disaster response plans. Detecting and mapping landslides rapidly after they happen will aid in first responder efforts, quickly showing where the damage has occurred and what routes to the location are still accessible.
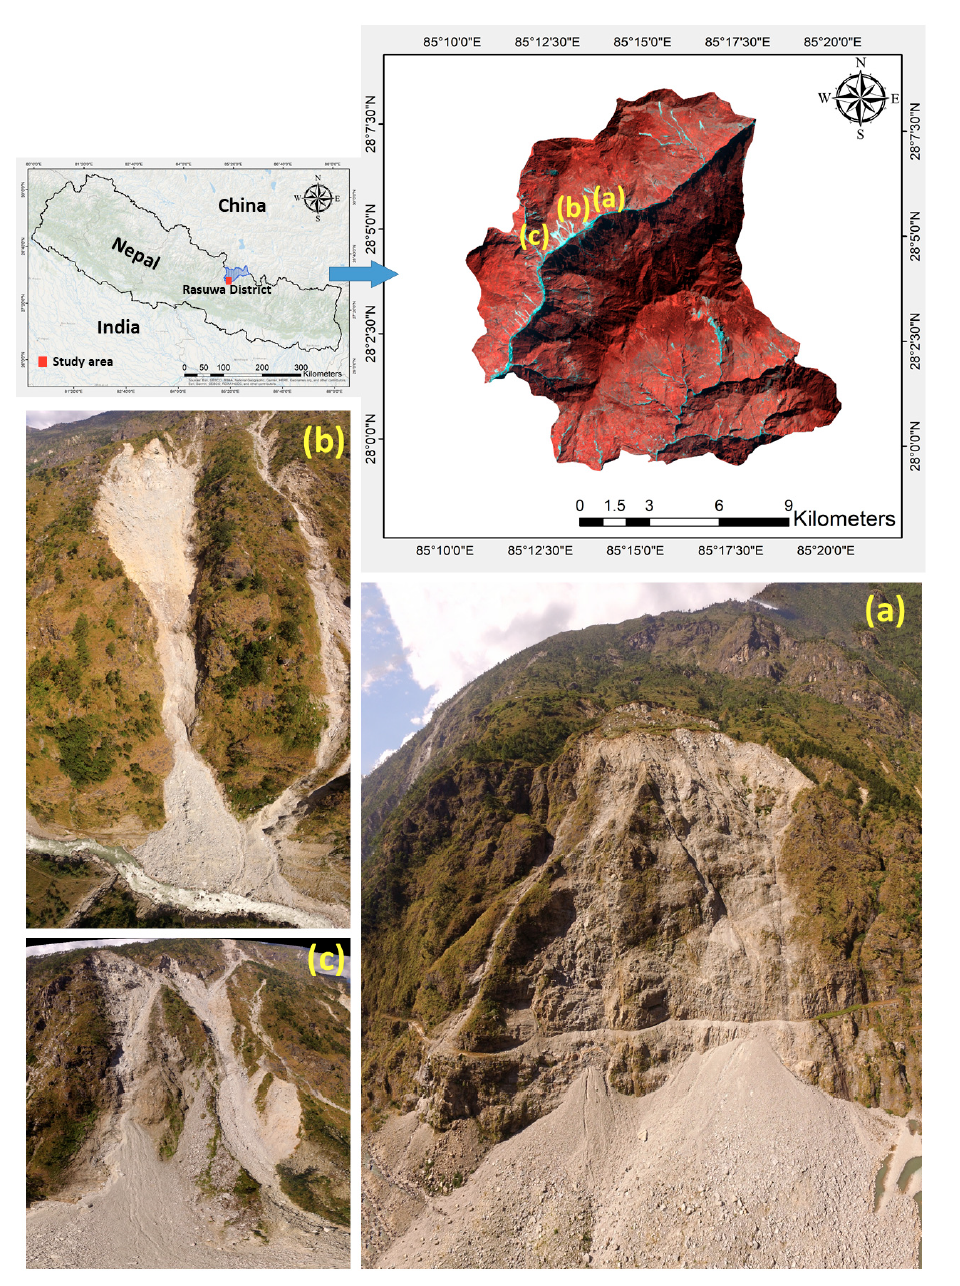
Images of the study area a false color composite image of the orthorectified analytical scene of PlanetScope satellites and photographs of landslide events in Rasuwa district. Credit: Landslide detection study, Piralilou et al.
Hurricanes and tropical cyclones are two major drivers behind landslides in the Caribbean, Central America and Southeast Asia. They are also responsible for widespread coastal changes. Newly published research out of San Diego State University and Scripps Institution of Oceanography, conducted by Joshua Kelly and Allen Gontz, looked at changes to the coastline of Southeastern Queensland, Australia, resulting from the Category 2 Tropical Cyclone Oma, which struck in February 2019.
With the help of Planet’s Education and Research program, Kelly and Gontz used 3-meter PlanetScope imagery to map the high water line along 200 km of coastline. The high water line gives an unambiguous marker by which to measure changes in shorelines: The color difference between dry and wet sand and rock. To sufficiently resolve this line, high resolution imagery is necessary. Airborne surveys of the area were prohibitively expensive, and other satellite imagery was of too low spatial and/or temporal resolution to implement this mapping technique in a way that the changes could be directly tied to Tropical Cyclone Oma.
“The capacity for rapid assessment of the condition of the coastal system after a major event is critical for management, disaster relief, and safety,” Kelly and Gontz note in their study.
While the coastal region was cloudy for nearly the entire month of February, Planet’s near-daily imaging captured three images with few enough clouds to see the shoreline: Two pre-Oma and one immediately post-Oma, allowing these researchers to pinpoint the exact changes caused by Oma. They found that across the beaches they observed, shorelines changed between about 10 to 100 meters due to erosion from the storm—in some places in terms of removal, in others in terms of material being deposited. The resolution of PlanetScope also allowed them to observe other effects of the cyclone such as changes in vegetation, lagoons, and spits.

A high water line along the coast of Queensland as visible in a PlanetScope image, denoted with the dashed line. From Kelly and Gontz (2019).
When imagery is spaced weeks or months apart, it can be difficult to attribute changes with certainty to a specific triggering event. Planet’s “always on” imaging mode gives rapid post-disaster coverage without having to wait out weather conditions, or dealing with the time and logistics of planning aerial or drone imaging of the affected area.
“PlanetScope’s daily repeat interval allowed for a near-immediate mapping of the shoreline in the aftermath of a significant storm event…which is of great interest to local decision makers for shoreline management strategies,” say Kelly and Gontz.
Planet’s time stack of near-daily coverage was also critical to this study. The most recent airborne LiDAR survey of the region was conducted on July 25–28, 2018. A cloud-free PlanetScope image was acquired just four days later on August 1st. This gave Kelly and Gontz a control point—no significant changes were likely to have occurred in those four days based on the weather at the time. Combining the PlanetScope and LiDAR data gave a correlated visual and topographic snapshot of the shoreline to which they could compare the effects of the cyclone.
“The acquisition of global high-resolution imagery at a daily repeat interval has been and will continue to be shown to be paramount in modern and future global change studies,” Kelly and Gontz state in their paper.
With PlanetScope keeping a constant watchful eye over our planet, we can be better armed to respond to disasters as quickly as possible, helping to save lives and mitigate economic impacts.
Learn more about how Planet’s Education and Research program could help with your research here.


)